The election is over and Barack Obama has been re-elected for another four years. In market terms this means continuity and we will find out where current policies, still directed by the mad munchkin at the Fed, will eventually take us.
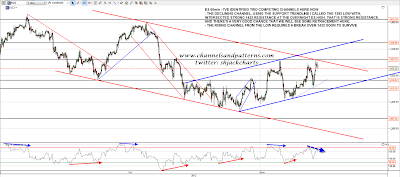
Short term the chart I capped two hours ago on ES a couple of hours ago, and annotated predicting retracement from the 1432 retracement level that I was talking about yesterday morning, is already very out of date, as that retracement is now well in progress. I don’t have time to redo it so here it is. There is decent support at 1410, and the last two lows are at 1411 (overnight) and 1402.5. A break below 1402.5 would open up a test of the 1393 low that might go as low as 1388, which I’d expect to hold:
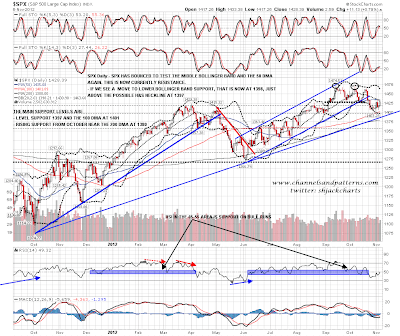
On the SPX daily chart the middle bollinger band and the 50 DMA were tested again yesterday, and the strong support levels to watch today are the 100 DMA at 1401, the lower bollinger band at 1398, and rising support from the October 2011 low in the 1385-90 area. This is a very strong support zone and I am assuming that this will hold on any test of the lows until we either see a clear break below the 1385-90 area, or a weekly close well below the weekly middle bollinger band at 1407:
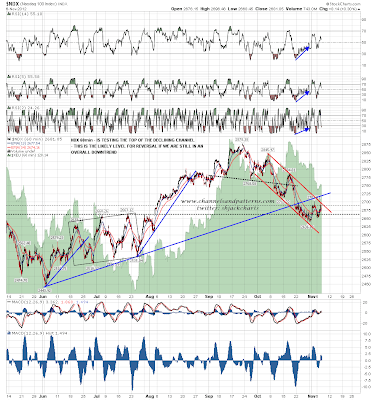
I posted the NDX 60min chart on twitter yesterday afternoon showing the test of declining channel support there yesterday. That was the obvious reversal level and it’s possible we could now see NDX make convincing new lows as channel support is slightly under 2600. For the moment though I’m assuming that the current lows around 2636 will most likely hold as a reversal W bottom continues to form:
The Dow is worth a look this morning as a very nice rectangle bottom has been forming there. Despite the name this is actually a 55% bearish pattern, but the pattern performs best on upward breakouts. Rectangle support is in the 13040 area and rectangle resistance is in the 13300 area. I’m leaning bullish on this pattern unless we see a clear break below it:

My EURUSD chart this morning is also now out of date, as the possible flag channel I had identified has now broken downwards. As I mentioned on the chart, this means that the target I gave earlier in the week in the strong support area around 1.244 is still the main downside target:

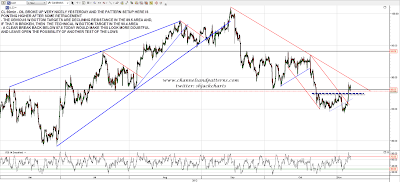
My CL chart is not out of date yet. There has been a retracement overnight from the high yesterday and I’m still leaning bullish as long as the 87.5 resistance turned support area holds, which it is still doing. Upside targets are declining resistance in the 89.5 area and, on a break over that declining resistance, the W bottom target in the 90.4 area:
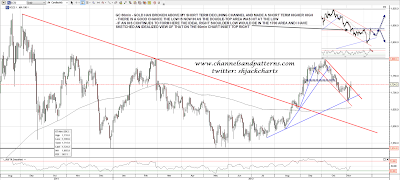
Gold had a strong move up overnight on Bernanke’s sort of re-election, and I think there’s a good chance we have now seen the retracement low there. If the current short term high holds we may well see a reversal IHS form and the ideal right shoulder low would be in the 1700 area. I have sketched an idealized version of how this would look on the chart. On the bigger picture gold is 10% above major support, my ideal eventual targets for the bull market on gold are somewhere between 100% and 300% away, and there is a strong bull pattern that has broke up in August with a target in the 2050 area. I like gold a lot here:
I don’t have a clear downside target today, but SPX has been holding above the key support levels so unless that changes I’m thinking that we have made or are very close to making the two month retracement low. Fiscal cliff permitting, this is the obvious place to start the rally into Xmas that would normally start here in an election year. I’m a bit doubtful about a long term cross-party budget deficit agreement being agreed next year, but I’m expecting the parties to at least agree on a significant delay into 2013 to allow time for such an agreement to be attempted.




