Slope of Hope Blog Posts

Slope initially began as a blog, so this is where most of the website’s content resides. Here we have tens of thousands of posts dating back over a decade. These are listed in reverse chronological order. Click on any category icon below to see posts tagged with that particular subject, or click on a word in the category cloud on the right side of the screen for more specific choices.

SPX Breaks Rising Channel Support (by Springheel Jack)

By -

I won't include the SPX daily chart today as I posted the SPY equivalent yesterday in my weekend post at MarketShadows and you can see that here. What I have to add to that this morning is that I have had a close look at the current bollinger band setup back to the start of 2009, and have come up with the following stats:

  1. 9 instances – Touch and reversal or 2 day base at the lower bollinger band.
  2. 7 instances – A plunge through the lower bollinger band.
  3. 10 instances – Riding the lower bollinger band downwards as we are seeing at the moment. 
Of this last group of 10, which is the group of interest today, and we would now be starting day 4 as the first touch was on Wednesday, the outcomes were as follows:
  1. 2 instances – A low on the third day – short term bullish
  2. 6 instances – A low on the sixth or seventh day 20 to 70 points lower – short term bearish
  3. 2 instances – A low on the tenth day or later over 50 points lower – short term bearish

(more…)

Rotten AAPL Revisited (by Springheel Jack)

By -

I think AAPL is a great company. My family own three iPads, two iPhones and I've even toyed with the idea of buying one of their desktop computers. A year after the death of Steve Jobs AAPL is looking stronger than ever, with just a minor couple of glitches at the launch of the new iPhone as their competition with Google intensifies. I won't be upgrading the OS on my iPhone until there is a Google Maps app but that is a minor irritation. 

As well as an AAPL admirer though I am also a chartist, and my strong belief is that the charts should lead without the chartist imposing any preconceptions on where they should be heading. I therefore posted a couple of charts on 13th September mentioning that the setup on AAPL was looking potentially bearish. You can see that post here. I then wrote follow up posts on 2nd and 4th October talking about the alarming RSI setup on the weekly chart and the retracements that this has always led to in the past, and the possible sloping H&S that was forming on the daily chart. You can see those posts here and here

(more…)

Possible Double Top on SPX (by Springheel Jack)

By -

As I was suggesting it might, SPX tested the highs and the upper daily bollinger band on Friday and reversed there. That leaves a possible short term double-top in place on SPX which would trigger a target in the 1385-90 area on a break below the late September low at 1430. I'm not actually expecting that to happen, 65% of double-tops never make it back to the valley low, but it's something to bear in mind. Until that happens though there is very big support around there at SPX rising channel support, the lower bollinger band and the 50 DMA and that would be hard to break below:

(more…)

Upside Targets (by Springheel Jack)

By -

On the SPX daily chart yesterday we saw a clear break up from the middle bollinger band and the minimum target for that break is the upper bollinger band, which was at 1472 at the close yesterday. I'm expecting a retest of the highs and most likely another smaller retracement from there to test (and possibly break) SPX rising channel support, which was not hit on this retracement and is unfinished business below. That said the daily bollinger bands have pinched in, and historically that has generally led to a strong trending move that pushes the upper bollinger band up considerably. If we don't see a reversal in the 1470-80 SPX area, the upside target would therefore be at rising channel resistance in the 1500-20 area, which also has some longer term resistance that I will be talking about in detail if we see no reversal near the current 2012 high:

On the SPX 60min there is no current sign of a short term high and I'm expecting more upside:

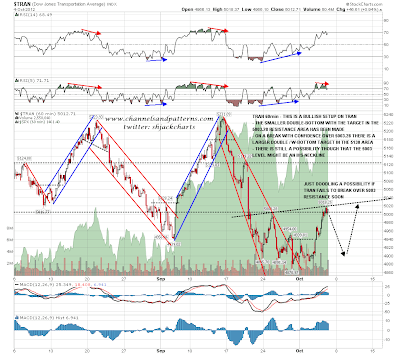
TRAN is still in a possible reversal area around 5003 resistance. On a break above with any confidence the upside target is 5130 area resistance but until then we could see a significant reversal here:
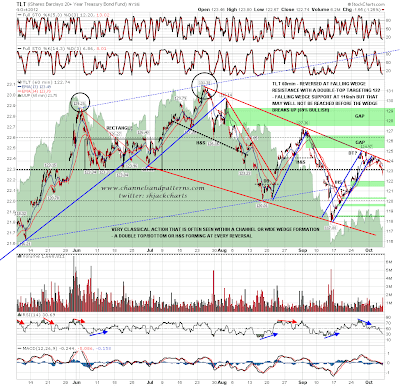
TLT has broken the small double-top trigger level with a target at 122. Falling wedge support is in the 116 area but the wedge has three touches each side now and that support may not be reached before the wedge (69% bullish) breaks up. This is another reason why I think we may see more retracement from the 1470-80 SPX area:
I was talking about the bull case on CL yesterday and there was a very nice bounce there. I have a likely target for this move in the 93.3 – 93.7 area but short term CL will need to break up from the possible declining channel on the chart below. I'm expecting that to break but I'll be happier about more upside on CL once we see an hourly close over it:

In fundamental terms EURUSD looks very unattractive, but short term that doesn't mean a lot. In technical terms there is a very nice bull setup here with the IHS targeting the 1.313 area and a probable retest of the highs around 1.317. There is also now a strong support trendline in the 1.288 area and the bear case on EURUSD would only start to look slightly interesting on a break below that. Rising support from the low is now at 1.2725 and if that breaks then EURUSD would most likely retest the lows. Until then though, the highest probability path on EURUSD here is currently upwards:

I haven't time to post a gold chart today but I've mentioned regularly that the 1800 resistance level is a likely area to see a strong retracement. That is still my view and historically gold tends to decline in October. The chances are that will happen this year too. That is another reason to think that SPX may have more consolidation ahead as gold and equities are strongly correlated at the moment. We'll see how that goes. 

For today I have a strong resistance level on ES at 1462, and an hourly close above should clear the path for a SPX to reach the upper bollinger band and retest the current highs. ES is testing that level now and if we see some early weakness today, it would most likely be from there. 

I'm taking a long weekend to see some old friends and won't be around much today. 

Channel Magic (by Springheel Jack)

By -

SPX broke below the middle bollinger band on the daily chart yesterday and ES has been bouncing overnight. That looks like a bear flag so far, and we'll see today whether the middle BB at 1437.67 SPX and the rebroken SPX pivot at 1440 SPX can now hold as short term resistance. It's worth noting from the chart that the daily RSI is now almost back to 50. In a strong bull trend the 45-55 area acts as decent support as I've marked on the chart, so we are now in the likely reversal zone here for a reversal back up if this is just the retracement on equities that I think it is:

(more…)
