Yesterday was a mixed day for technical signals but did deliver some useful levels, trendlines and inflection points. On both ES and SPX we now have clear declining channels from the high. These are shallow and look corrective so far. Here's how that looks on the ES 60min chart, with the notes that positive RSI divergence should be disregarded as the bounce between went over RSI 60, and that a break above this channel would look bullish and should deliver at least a test of the highs:
Slope of Hope Blog Posts
Slope initially began as a blog, so this is where most of the website’s content resides. Here we have tens of thousands of posts dating back over a decade. These are listed in reverse chronological order. Click on any category icon below to see posts tagged with that particular subject, or click on a word in the category cloud on the right side of the screen for more specific choices.
Another Stroll Through Time w/ the HUI-Gold Ratio
This is just a friendly reminder about how bloody important it is for
the HUI-Gold Ratio (HGR) leading indicator (to the precious metals
sector) to maintain its higher lows status.
Wild Card GDP Number (by Springheel Jack)
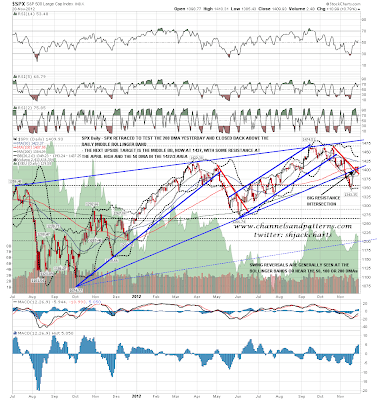
The retracement low yesterday ticked most of my boxes. On the ES 60min the M top target at 1383 was tested, but 1388 support held on an hourly close basis. On the SPX daily chart we then saw the close above the middle bollinger band at 1394 that I was looking for. The upside target on the SPX daily chart is the upper bollinger band at 1437 (still declining slightly), with some potential resistance on the way in the 1422/3 area at the March/April highs and the 50 DMA:
Mixed Signals (by Springheel Jack)
Yesterday was weak on SPX as expected, but the seasonality today doesn't give a clear direction and the signals are mixed. On the daily chart SPX held above the daily middle bollinger band and broken trendline resistance, but the daily candlestick was a hammer, which after an uptrend often signals retracement or consolidation. I've marked some examples on the chart below:
HUI-Gold Ratio; 3 Views, 1 Conclusion
Here is a little snippet from NFTRH 213 that showed the important
indicator of gold sector health, the HUI-Gold Ratio (HGR) from three
different views; daily, weekly and monthly. As you can see, daily must
hold to keep the weekly intact, which in turn must hold to keep the
monthly big picture of the secular bull (for the HUI, not this sad looking ratio) intact.
This is a difficult sector to own and indeed these charts say it is
best to trade the stocks regardless of what one does or does not do with
the bullion. But the conclusion is that until the HGR breaks down to a
lower low, the current situation is viewed as a buying opportunity. On
the other hand, HGR will serve as a handy risk management indicator if
it should unexpectedly collapse. From #213:
Daily HUI-Gold Ratio (HGR) needs to hold a higher low to both the May and July lows here or else the story is bearish…
That is because a new low here would threaten the higher low from
Armageddon ’08, highlighted in yellow, per the chart directly below…
Which would in turn threaten 2008’s higher low to the one from the beginning of the bull market in 2000.
So you can see that it is kind of important that the daily HGR hold its parameter.
It is a simple conclusion; HGR must hold a higher low on the daily to
avoid a threat to the July and May lows so that the weekly view can
remain intact and not threaten the 2008 low and eventually, the secular
low of 2000. Meanwhile, higher low status across all time frames means
the indicator is not broken, despite the formerly “normal” correction
that become somewhat intense last week.