Slope of Hope Blog Posts

Slope initially began as a blog, so this is where most of the website’s content resides. Here we have tens of thousands of posts dating back over a decade. These are listed in reverse chronological order. Click on any category icon below to see posts tagged with that particular subject, or click on a word in the category cloud on the right side of the screen for more specific choices.

Market Sickology

By -

Let me start by saying how pleased I am that my conjecture yesterday about the market's near-term direction has been correct so far. As a reminder, here was my prediction (drawn in green)…….

0429-es

…..and here's what we've seen since then………………

0430-sofar

Ahem. Pretty stunning, huh? How did I do it? With the KnightVision system, which I'm selling immediately for the low, low price of $49 per day! Operators are standing by! 1-800-TIM-RULZ

No, that's not it. My method was simple enough. I look at 5,000 charts every stinking week. I've been doing this for twenty years. Look at enough charts, and you get good at it after a while. I have looked at literally hundreds of thousands (God help me…………) of charts in my trading lifetime. So my brain is full of this crap.

Now, listen, I've made plenty of "bold predictions" which were worth less than Lloyd Blankfein's good name. I declared in October, I think it was, that the S&P had topped out. Errr – -that wasn't the case. So as I'm standing here beating my chest about my oh-so-brilliant prediction, I do so with the knowledge that I've had lots of lame-o attempts at divining the market's next moves in the past.

The difference this time is that I was really, really confident of what was going to happen, just like I was back in mid-January when I stared at my 30" Apple monitor and felt a glow of assurance about what was coming next. It is truly gratifying to see things pan out so far. If the entire pattern completes, you'll have to forgive me if I put these charts up at least a few dozen more times in order to cluck about it.

There was a bit more to it, though. I mentioned getting a completely snarky email last week – – on the 23rd – – which, by the way, marked the exact day of the highest close on the Dow. On top of that – – and this actually had much more weight – – a stunning number of Slopers yesterday seemed to finally throw in the bear towel. I don't think I'd ever seen so many people saying – in their own words – "I give up. I'm sick of losing money. I'm joining the bull camp and am just going to buy all the dips."

They didn't say it to be funny or sarcastic; they were serious. And when Slopers………..the bears' bears ………surrender, well, things are bound to get interesting. So I was shorting like crazy during yesterday's ridiculous rally.

I have survived the past seven months by being very "light", committing only 30% to 50% of my cash to positions, and by avoiding options and leverage. It's been a losing stretch of time, but only a single digit percentage loss, and something from which I feel I can handily recover. No one likes a loss, but in the face of a 25% explosion on the Russell 2000 over the past seven months, I actually feel OK about it.

My point is that I am finally comfortable being 100% committed. Further, if things continue to break my way, I am comfortable pushing into leveraged territory. As a trader, I strive to lose money slowly and make money quickly. I have excelled at losing money (!) slowly over these months, but I believe things are setting us for some serious money-making. At least that's what I hope!

Anyway, it's been a good week, and I'm going to rest. I'm still stuck in France time, and getting up at 3:30 each morning is getting kind of old. Hopefully this weekend I can shake off this jet lag and resume a more human schedule. Have a good weekend.
Market Psychology (by biiwii)

By -

Given that the broad global rally off of unsustainable negative
sentiment has ground on much longer than many (my hand is raised)
originally thought, it is logical to assume that this condition may be
challenging many peoples' resolve. We track 'dumb/smart money'
sentiment nearly every week in NFTRH, and the
reason is that despite technicals and fundamentals, the market will only
change course in a significant way when the psychological profile is
allows for it. More and more, it looks like extremes will need to be
registered, perhaps with the intensity of Q4, 2008 to Q1, 2009 only in
the opposite direction. They are on their way.

NFTRH82 highlighted gold sector
technicals and fundamentals in relation to those of the broad market,
charted up other markets, indicators and stocks, and reviewed the
updated dumb/smart sentiment picture. But in the middle of all this,
the following bit of psychological navel gazing found its way in there
as well, perhaps as a way to work through the fact that the market has
not yet conformed to conclusions that the writer 'thinks' he knows are solid ones.
🙂

Here is a secret; none of us has the divine right to the
answers. To ultimately win at this sometimes manic game, we must employ
a wide spectrum of technical and fundamental tools, but also be aware
of sentiment and psychology both from a collective standpoint and a very
personal one as well. In other words, know our competitors and even
more importantly, know ourselves.

Market Psychology

At the risk
of exposing myself as the psychologist wannabe that I am (there are
multiple mental health professionals in the subscriber base), let’s
think about the general [psychological] profile currently in play. Many
of us are micromanaging the massive rally off of the bottom of just
over a year ago. Some, like NFTRH are
micromanaging a would-be top. Others are going with the bullish flow,
secure in the reinforcement of ever increasing positive sentiment.
Still others are sitting sidelines, having been out since compelling
downside sentiment forced them out in preservation of their sanity. I
would venture that the market is wearing on a high percentage of
people’s nerves.

As a currently bearish newsletter writer, I have
to tell you about something that makes me uneasy regarding my stance,
short term. As part of the bus tours around Manhattan my family,
friends and I enjoyed last week, we were taken through the Wall Street
area among many other places – the memorials at the church at Ground
Zero brought me tears and a rush of returning memories – we went through
Wall Street twice. Each time, different tour guides made cracks about
the crooks there and all the money that people lost. My thought was
‘dude… where have you been for the last year?’ with regard to the rally.
Maybe when the tour companies drop that shtick the rally will be ready
to roll over.

Anyway, a micromanaged rally is not likely to end
on cue. That is one reason NFTRH81
noted that rallies don’t usually end on any given alarming news item.
Dubai? Greece? Goldman/Merrill? It is all good until one day, after
more cementing of perceptions, it no longer is. But the rally will not
end logically and in a nice neat manner in which bears can simply climb
aboard and short to the high heavens. Watching them scurry to cover on
Friday afternoons is almost becoming comical, and the market is feeding
on that.

This is why it is imperative to double check our own
individual psychological profiles so that we thoroughly know who we are
as market participants before deploying capital. This beast does not
care about you or me. All of that said, I am personally attempting to
employ the opposite strategy from that which I used late 2008 and early
2009; I am trying to remain cautious as opposed to brave. After last
year’s gains, I have been in ‘preserve capital’ mode for what seems like
an eternity, while holding a precious metals core-plus.

The
market wants me to feel like it is an eternity because it wants me to
become impatient and make a mistake. The market wants me to take my eye
off the ball either through fatigue or greed or some other screw up.
Ah, but I have a secret weapon; I get to sit down and write about the
current market situation each weekend and work through my thoughts after
the dust settles on a given trading week.

Nothing has changed
for me or for NFTRH
with the exception that the stance contrary to hope and greed has not
yet come to fruition like the one contrary the angst and fear of a year
ago did. I’ve got time. Not only that, but things are going better for
me personally now than they were a year ago and that helps me remain
focused, as opposed to dealing with vulnerabilities, which can manifest
as additional mental noise.

I will remain strong in my
convictions but only so far as the work that I do tells me to be so. We
will not institutionalize negativity, bearishness or fear of the future
here at NFTRH.
What we will do is make an ongoing honest attempt to be on the right
side of the macro trade, and if proved wrong, admit it and move on with a
new course.

So, another important aspect of good personal market
psychology is the ability to admit when we are wrong. It happens to
the best of ‘em and it will happen to each and every one us; every last
subscriber and the letter writer for sure. As of now however, I see no
sign whatsoever that a cautious stance is wrong in any picture beyond
the immediate manic bullishness. —http:www.biiwii.blogspot.com

Learning to Think Big

By -

A lifetime goal for me as a trader is the ability to recognize – – and hold on to – – stocks which experience gigantic gains over the long haul. These are the stocks on which fortunes are made, since the real winners can climb thousands of percent over a period of years.

In retrospect, it's pretty easy for a technician to see excellent basing patterns for stocks which have already enjoyed such gains. Take MMM, for instance, shown below. This stock climbed thousands upon thousands of percent over the past few decades, and you can see the oh-so-perfect saucer pattern which preceded the entire move. With hindsight, it's a cinch to see what a winner this chart was on a technical basis.

Picture 2

If we zoom in to that basing pattern when it occurred, however, it isn't nearly so clean. Since you know what happened next, it might still seem very obvious to you, but I am highly confident that most people, when looking at a chart like the one below, would consider it simply on the high end of a multi-year range and not a particularly good thing to purchase.

Picture 4

This topic was brought to mind this evening, since I own Cavium Networks (CAVM), and it had a good earnings report after hours. The after-hours quote shows a gain of about 8%, so tomorrow should be a good day for CAVM. But who is to say that, ten years from now, this isn't a $500 stock on a split-adjusted basis? That seems absurd, but all huge gains seem absurd before those gains are actually enjoyed.

Picture 1
 

What I'm trying to say is that it takes vision to see a chart and imagine what that same chart would look like when it constitutes only 10% of a long-term chart in the future. There are probably only a small number of people who bought MMM who own it to this day, but those people haven't paid a penny of taxes on those gains, and they are sitting on a fortune of profits. What I want to develop for myself is the ability to hang on to select long positions over the very long haul, exiting them only when the violate an up-to-date stop price. As nice as it would be to bounce out of CAVM tomorrow for a quick 8% profit, I will instead just update the stock and let it ride.

Mole’s Quick And Mostly Dirty Weekly Forecast

By -

<shameless plug>The following was available to Evil Speculator subscribers over the weekend. Unlike other subscription blogs Evil Speculator has been shifted towards a hybrid system in which important analysis and trade ideas (i.e. symbols, setups, etc.) are available to subscribers first but are later opened to a general audience. If you are 'evil speculator curious' drop by for a visit anytime – we're up to no good on a constant basis.</shameless plug>

Alright, let's dig right in:

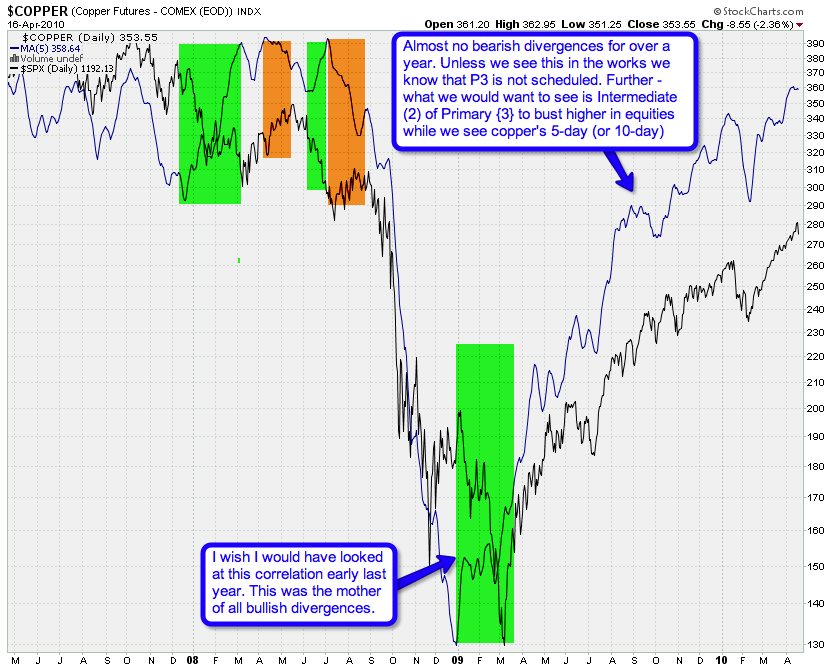
We are thinking long term here. This is my radioactive fusion
powered 5-day MA Copper/SPX chart. The MA is on the Copper futures and
what we are looking for are long term divergences. Yes, long
term – the short term is way too noisy for me to attach any
interpretations. Quite salient is the ‘mother of all bullish
divergences’ in March of 2009. Wish I would have seen this one back
then as it would have helped in assessing the timing of the finale of
the trend.

But wait – there is more. Let’s project forward a little and
consider what ‘may’ happen if we get something that may look like the
onset of Primary wave {3}. After the first major drop we would a see
snap back into Intermediate (2) – which should not be confirmed by the copper futures.
Remember – we are looking for divergences in the scope of Primary or at
least Intermediate degree moves. Anyway, it’s a good theory – for now –
let’s keep an eye out and put it into context along with some of the
other charts I’m peddling here.

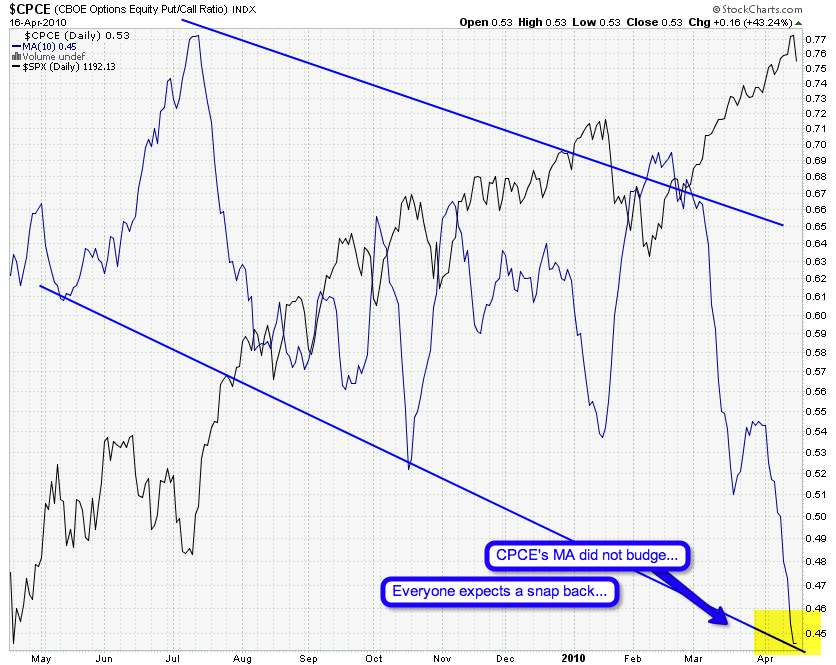
That’s this week’s shock and awe chart – I’m shocked that
the CPCE’s 10-day SMA did not budge after Friday’s drop. My take – the
bulls see this as nothing but yet another dip buying opportunity. Well
– we shall see shortly.

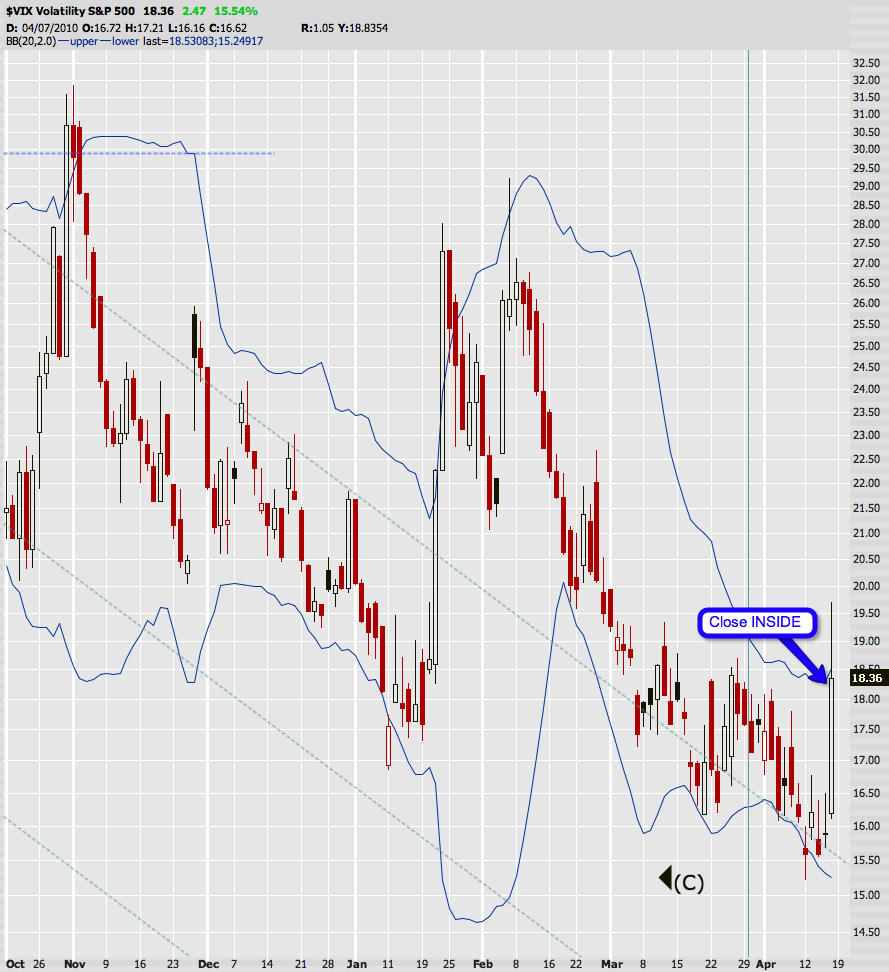
During Friday’s session got dangerously close to busting outside the
upper border of the 2.0 BB on Mr. VIX. Fortunately we did close inside
– meaning no buy signal (yet). Doesn’t mean we won’t get one though –
IMNSHO we might see a repeat of what happened late January.

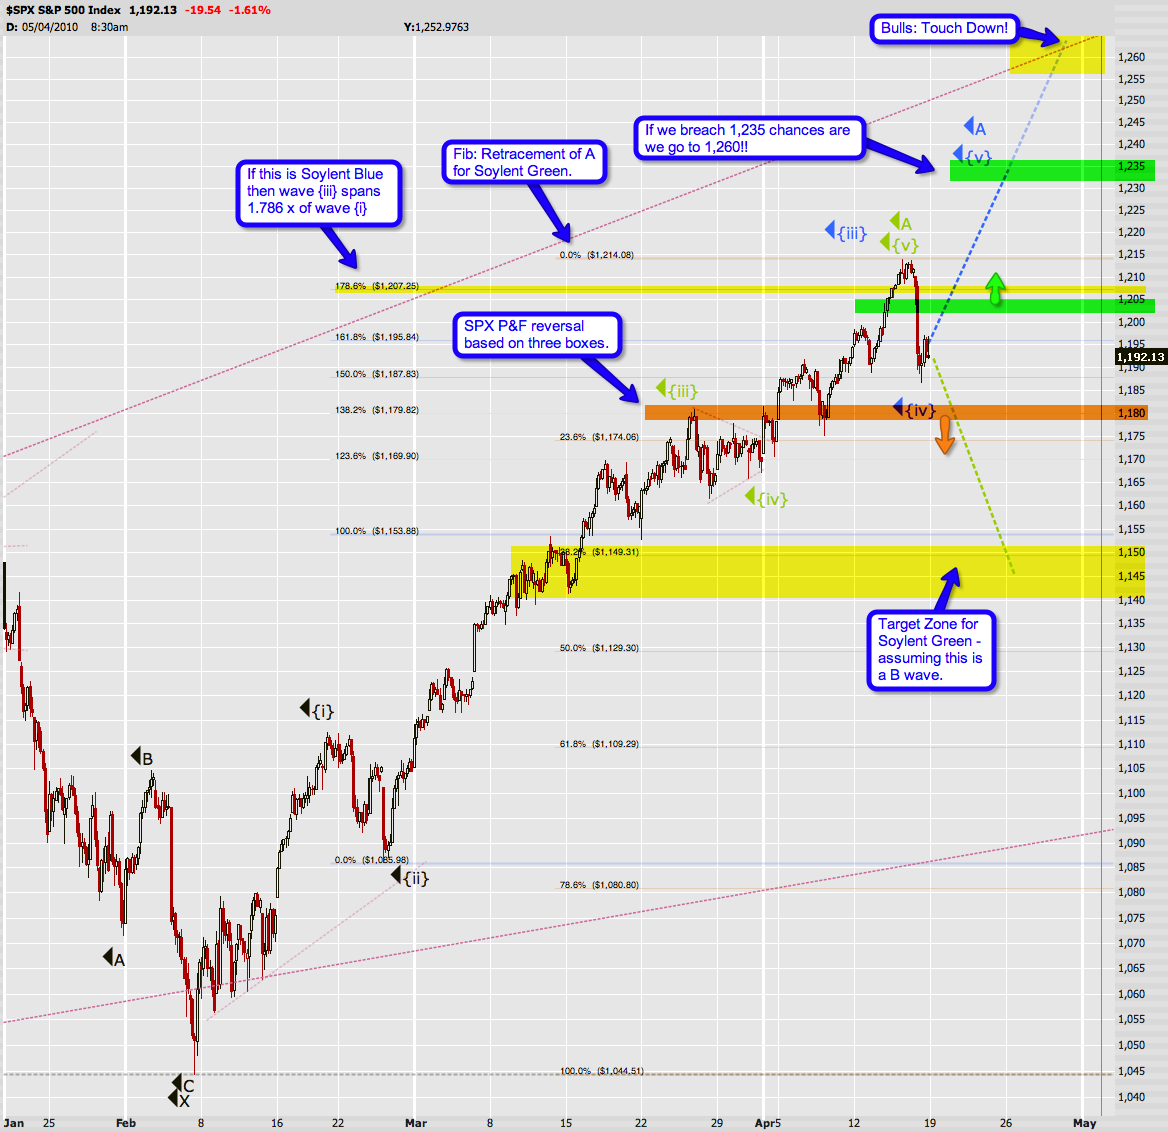
I’m no P&F pro but that upper trendline I pointed out last week
seems to have served as resistance – thus far. If we get a drop to
1,180 on the S&P 500 cash index this chart would show a first
circle as a possible beginning of a downtrend. Not sure if that is a
‘confirmation’ of a reversal but it does count and becomes part of the
chart, so let’s just go with that unless we hear otherwise from a
P&F pro. I have highlighted the 1,180 mark on my wave count below
as well:

2010-04-18_SPX_count

You might want to open this one in a separate window/tab by clicking
on it – it’s got quite a lot of detail. I won’t repeat all my comments
here but suffice to say that I have a feeling that things are slowly
shifting back into focus now. The retracements all line up quite nicely
and we might just have ourselves a map here.

Soylent Blue means that we are either done with Minute {iv} or will
be by around 1,180 – that P&F reversal point I highlighted above. I
postulate that we may bounce a bit before that and keep it off the
P&F chart – but that’s just a theory. If we keep dropping through
that point Soylent Green becomes a lot more realistic. The target for
Green is the 1,145 cluster as we are near a respectable fib lines, i.e.
38.2% on the way down and 100% of {i} on the way up. That’s right – I’m
the tamer of ferocious fib lines – Siegfried & Roy have nothing on
me ;-)

Some other comments on the chart – I think it’s a decent map – keep it handy as next week unfolds.

Cheers!

Mole