

Slope of Hope Blog Posts

Slope initially began as a blog, so this is where most of the website’s content resides. Here we have tens of thousands of posts dating back over a decade. These are listed in reverse chronological order. Click on any category icon below to see posts tagged with that particular subject, or click on a word in the category cloud on the right side of the screen for more specific choices.

Calling Reversals (by Springheel Jack)

By -

I've had a very hard time selecting charts to post this morning, as there are so many interesting charts that my initial selection for interesting candidates to post came to fourteen. I'll post an very unusually high number of seven charts this morning and put some of the others into a weekend post I'll post after the close tonight. My apologies to anyone who feels that seven charts in one post is too much to digest.

I wanted to say a few words on calling reversals this morning. Most traders call reversals regularly, and daytraders often call several on a single range trading day, but when an analyst calls a short term high nowadays, there tends to be a lot of dark muttering about calling the dangers of calling tops. There's an important distinction that needs to be made here, in that calling short term reversals is routine, and often highly profitable. It is calling major tops in a cyclical bull market that tends to end badly, though minor reversals sometimes have strong potential to turn into major reversals.

My point is that that I've called for significant short term reversals on SPX twice in the last three weeks. The first time was on Wednesday 19th January and we saw a decent retracement afterwards, and the second time was on Tuesday, and while we haven't seen a significant retracement yet, the market is currently lower than it was then, with no significant new high since, and every reason to think that it may go a bit lower before resuming an upward path. I've often called short term reversals in the past, and plan to do so often in the future. It's a fun game and, modesty apart, I'm often right. Anyone who wonders whether an analyst can really project reversals and targets with any accuracy should have a look at the ES chart I posted on 3rd August last year, in which I predicted the August reversal, and drew in the theoretical right shoulder of the potential IHS indicating to 1258 ES that we saw form and play out over the next six months. You can see that here. With the greatest respect to anyone who feels that buying the dip is the only strategy worth remembering, I'd point out that even to buy a dip, you have to select a likely entry, and in doing so, you are necessarily selecting a likely reversal area.

Does this minor reversal have the potential to turn into a major top? Absolutely, as any hit on the upper trendline of a big rising wedge has the potential to turn into a very major reversal, and I have several key charts that are flashing big red warning signs here, particularly on the EEM chart which has been a solid lead indicator chart over the last few years. It seems too long before the end of QE2 for a major high right here though, and I'd need to see some key support levels broken before I'd consider calling a significant top. I'd then need to see sustained weakness and some long term indicators turn red before I'd consider calling the end of the cyclical bull market. As some of these take six months or more to reverse, that won't be happening anytime soon. I'll post the EEM chart and some others that didn't make the cut today in a post this weekend.

There is one other chart to post today that is worth considering in terms of a short term reversal here. Blogger jonny O mentioned something yesterday that was worth charting up and showing everyone. I'd noticed it before, but had forgotten that it extended back below the 1000 level, and it is that from the 800s to the 1200s there has been a significant reversal every time that we have first hit the 20s level (plus or minus 10), into the 80s level (plus or minus 10). We saw that once each in the early 800s through to the 1200s with the last being the major interim top last April, and since then we've since it twice more in the 1100s, and once in the 1200s. That is a powerful repeating pattern, with the proviso that the short term reversal has gone considerably deeper than the target area with the first 1200s reversal and the last two 1100s reversals. I've marked this up on my main SPX chart for this cyclical bull market:

Short term, ES is still reversing gently after the support break earlier this week, and I'm expecting to see some more of that in the next couple of trading days unless we see ES make a new high:

EURUSD didn't form the potential HS pattern I was wondering about yesterday, but is making good progress towards the wedge support trendline regardless. If that trendline is hit today it will be in the 1.347 area:

GBPUSD provides a good example of why I hate trading triangles today, as the triangle I posted on it yesterday had false breaks in both directions before resolving downwards. I'm expecting to see a hit on the triangle target at 1.585 and it might go lower:

Copper has now formed a slightly sloppy declining channel since the recent support trendline break, and it's possible, though I haven't marked it on the chart, that a continuation HS pattern is forming within that channel to take it into the 441 area:

I was speculating about a possible break of the silver rising channel yesterday, and after a bounce yesterday that has happened overnight. I'm expecting to see some more downside on silver from here:

The lower support trendline on the broken rising channel on oil is now holding nicely as resistance, and a short term descending triangle has formed with a target at 84.10. Descending triangles have a 64% chance of breaking downwards, but in the larger context, and Egypt permitting, I'd put the odds of a downward break here considerably higher than that:
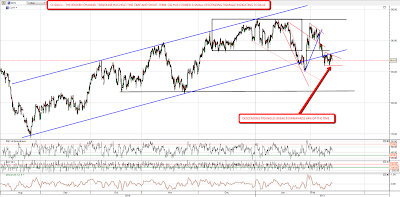
Of the short term charts that haven't made the cut today, AUDUSD has broken downwards as I predicted the other day and is now much of the way to my target in the 99.1-99.2 area and the ZB (30Yr Treasury) chart has now formed a full IHS indicating to the 119'25 area. I have a theoretical upper trendline for a short term declining channel slightly above there so I'll be interested to see whether that holds in the event the IHS breaks up. I'm still leaning sideways to down overall on equities today.

Treasury Yields – What Is Driving Them? (by Ultra Trading)

By -

In a prior post, I commented on the move in treasury yields since QE was first mentioned by the Fed in August of 2010.  The very short end of the curve has not budged but as you begin moving beyond one year and especially five years to ten years yields have moved substantially higher.

In the equity markets there is talk of the Bernanke put.  If any market should welcome this free option play it should be the bond market.  After all, the Fed has communicated regularly their goal of low rates for an extended period and the launch of QE to specifically keep rates low.  The Fed has said to the bond market we will put a floor under your security.  For some reason though the bond market has decided to take their ball and play elsewhere.  QE1 did manage to keep yields low when RMBS was being purchased.

There are a number of possible explanations for this move higher in yields.


  • The Fed has encouraged yield chasing and with commodities rising 30% in a matter of months or equities up 25% in five months, why invest in a ten year bond yielding 3%?  It would take you ten years just to match a three month return on a long rice trade.


  • The economy is improving so quickly that bond investors are demanding higher rates as the Fed will be forced to raise rates sooner than currently forecasted.  The problem with this argument is once QE2 was hinted at, rates began moving.  Perhaps the bond market was so confident in the success of QE2 and its ability to stimulate economic growth that bond yields responded immediately.  The results of QE1 combined with trillions in Federal stimulus did little to improve economic growth so why would QE2 be any different? 


  • Inflation is a concern and nominal yields are moving accordingly.  If you look at the TIPS market though (TIPS are inflation adjusted or real yields) inflation does not look to be much of a concern. The Fed's target for inflation is 1-2% annually so inflation is a concern beyond ten years but not much at just 36 basis points above the upper target.

                 5 Year Inflation – 1.50% in August 2010, now forecasted at 1.98%

                 10 Year Inflation – 1.86% in August 2010, now forecasted at 2.36%

                 30 Year Inflation – 2.18% in August 2010, now forecasted at 2.55%


  • The bond market is beginning to truly question the sustainability of US fiscal policy in the face of growing debt as a percent of GDP.  The question I would raise is why now?  Why not a few years ago?   The reality of investing in US treasuries is you are relying on additional debt to pay back your existing debt. The greater fool theory is the key to this market unfortunately.


The reality behind this move in yields is probably a combination of all of the above.  I was surprised in looking at the TIPS data to see how low inflation expectations truly are.  I think the inflation or deflation argument comes down to one simple truth.  Does QE choke off the remaining final demand in the economy before velocity explodes the money supply?  My vote is the former.  The bond market is sending a signal and one that needs to be watched as it will have direct implications on future monetary and fiscal policy. Let's hope it finally forces some discipline at the Fed and DC.  

Submitted by Ultra Trading.  If you would like to read more, please visit - Ultra Trading

QE Headwinds (by Ultra Trading)

By -

QE is a mighty force.  In ordinary times, global food riots and contraction in the labor force (36,000 jobs added does not cover the 150,000 needed for population growth) would cause a fierce sell off in equities. Not in these abnormal times where the perceived deep pockets of the Fed keep a perpetual bid in the market.   

The day QE ends there is a very high probability the race to the exits will be swift and fierce.  Investors are asking themselves how long can this go on.  The vast majority are saying QE2 will not end in June but rather continue indefinitely.  Perhaps the majority are correct although group think rarely works. The Fed's ultimate goal with QE was to drive demand back into the economy.  Whether it be perceived inflation (x will cost more tomorrow so I'll buy it today) or perceived wealth the theory is growth in demand causes growth in the economy thus causing more demand until finally the economy is self-sustaining.  

In the process the banking system is generating income by playing the role of broker between the Fed and Treasury.  So on the surface, from an academic standpoint it sounds good.  Like everything in life though there are unintended consequences.  These miscalculations or unforeseen problems can negate the benefit of the original plan.   One such problem is surfacing rapidly and if not addressed will create another shock to an already fragile banking system.

An economy grows through the creation of credit and the banking system is the heart of credit formation. The US economy is held hostage right now as the banking system, conservative in nature, takes its time to return to health.  The banking system has a balance sheet with vast exposure to residential and commercial real estate.  Should there be another leg down in that sector of the economy, the banking system will be challenged as it was in 2008.   

Unfortunately for the banking system, home prices began their second leg down once the final tax credits wore off in October 2010.  This new leg down could experience a rather vicious  cycle.  Studies have shown a strong correlation between the level of negative equity in a home and one's decision to strategically default.  The industry is currently working through a massive shadow inventory that will cause pricing pressure for years.   The more prices fall, the more the shadow inventory grows due to strategic defaults and thus the problem grows. 

The last thing the industry needs right now is anything that puts additional downward pressure on price. Unfortunately, due to the Fed's QE monetary policy and horrific US fiscal policy, a very real threat has risen in the form of higher interest rates.  

Here's an example.  The debt service on a $300,000 mortgage at 4.75% for 30 years is $1,564 per month. The debt service on the same mortgage at 5.00% is $1,610.  In other words that buyer in a 5.00% interest rate environment can now afford a home 3% lower in price.  Over the past three months, the ten year treasury has risen 100 basis points in yield.  That's four times the example above.

Should this trend continue the bank balance sheet risk and reduction in wealth affect from one's home will have massive implications to an already fragile economy.  The economy will be faced with a reduction in demand and in the formation of credit.  Two very strong headwinds and two which easily can outweigh the benefits of the original goals of QE.  

Submitted by Ultra Trading.  If you would like to read more, please visit my blog at - Ultra Trading

Inflation & Popular Strife

By -

Click graphic below and check out the inflation 'heat map' at the WSJ, which I first came across @ Zero Hedge).  

Inflation heatmapt_0

First off, a qualification.  This is not a map of inflation, it is a map of the global effects of inflation, including places like Egypt, like Pakistan, like Venezuela, like Nigeria, where the effects (chronically high prices) have saturated and become deeply embedded. 

Egypt is a country in which around 40% of the people live below the poverty line.  Add the effects of inflation, rising and battering day after day, month after month, year after year… and you have a cauldron more than ready to boil over.  Not that the people in the street are economists or even financial students like us, but consider that the global economic revival currently in progress is aimed at asset owners and the most powerful financial entities – at the expense of people the world over just trying to make their already stretched Pound (Egypt's currency), Rupee, Rial or what have you – buy the necessary things in life.

Check out the sedate looking 'inflation effects' status of the US, which the Fed Chairman either pretends is real or worse yet, is stupid enough to actually believe, and you can clearly see why he has an implied carte blanche to keep on the current inflationary process of monetizing debt and printing money.  Deflation is the handy dandy threat used to support this.  The question is, when will the US saturation point be attained?  When will the same happen for other developed nations?

In NFTRH, this is the overriding long term theme as we move further along the continuum of conventional slumber we currently enjoy.  Things change, and sometimes they change radically and seemingly out of nowhere.  But we know better.  We watched the 2008 mess put a punctuation on years of degradation.  We do the same now for what comes next.

Money supply will eventually be followed by supply/demand dynamics, with prices getting out of control to a degree that even the official, massaged numbers will look bad.  Asset owners are being rewarded and speculators are being encouraged the world over.

Our ultimate trigger, the monthly EMA 100 on the long bond, along with several other indicators, is at an inflection point but not yet activated.  So, there remains an opportunity for the guys who EVERYBODY KNOWS are wrong – the deflationists – to get very right in the interim.  Think about it, from a contrarian perspective, EVERYBODY is (rightly) concerned about inflation.   

It's a crowded trade, to say the least.  And now whole countries are starting to boil over.  Like I said, 2011 is going to be one supremely interesting year and you just gotta love this or get the hell away from it.  Pretend it doesn't exist and let your financial professional handle the murky details.  Because the Devil is in the details.

http://www.biiwii.blogspot.com
http://www.biiwii.com