Slope of Hope Blog Posts

Slope initially began as a blog, so this is where most of the website’s content resides. Here we have tens of thousands of posts dating back over a decade. These are listed in reverse chronological order. Click on any category icon below to see posts tagged with that particular subject, or click on a word in the category cloud on the right side of the screen for more specific choices.

VIX Buy Signal (by Springheel Jack)

By -

Yesterday was a mind-numbingly tedious day and essentially nothing happened, so I'll post three to-the-point short term charts and move on to more interesting things. The first chart is the NQ 60min chart, where a broadening descending wedge has formed in the last couple of weeks. Within that wedge we appear to be forming a bull flag but may instead be making a short term top. Declining resistance is firmly established at 2325.5 and (bull flag) support is at 2312.5. A break with confidence in either direction will look significant and while I've been writing NQ has broken the support level on the range, so today looks likely to start out bearish:

The second though slightly longer term chart is the IWM chart, where broken support has been tested twice now without breaking. There is some significant resistance here:

I posted the Transports index daily chart the other day to show the growing divergence between the Transports index and the Dow, which is of course a growing Dow Theory non-confirmation. That divergence has been widening this week so far:

As I mentioned yesterday, the next upside target on the ES daily rising wedge is now in the 1315 ES area, and I'm expecting that to be hit in the next few days, so I'm leaning bullish overall for the rest of the week. Interestingly we had a confirmed Vix buy signal (for equities) yesterday so I thought I'd have a careful look at the Vix today. I've charted up the closes above the daily bollinger bands on Vix in the last fourteen months, and examined the performance of the confirmed and failed Vix buy signals over that period. The performance of the confirmed signals wasn't bad at all, with all five previous confirmed signals being before or during significant bounces on equities. Of the three failed signals two preceded large drops and the last failed to signal the huge bull move after the August lows. The signals seem to indicate that a 50 point + move in SPX is imminent or in progress, though with ES currently up 36 points from the weekend lows it might be that the signalled move is already mostly complete.

Other interesting things to note about the signals over the last four years were firstly that there were no instances in the last few years where a confirmed signal was given just before a major top, and that significant highs or lows have often been signalled with with two breaks above the Vix daily bollinger bands within a three week period of which at least one was a close above it. These signals were given in Oct '08, Jan '09, March '09, Jan/Feb '10, Aug '10 and Nov '10. These signals seem to signal highs in a cyclical bear market and lows in a bull market and with the exception of the July '09 low, they caught most of the significant bull moves since this cyclical bull market started in March 2009:

While I was looking at the Vix I also looked at the monthly chart since 1990, which was likewise very interesting. There is a support floor on Vix in the 15 area which has only been broken twice in the last twenty years. Firstly in the 1992-6 period and then in the 2003-7 period. Vix traded well above it for the whole of the technology bubble period in 1997-2000 and in the 2002-7 bull market it was broken just over a year into the bull market, so at a much earlier stage than we have reached in this one. It may well therefore be that this Vix support floor will hold for the entirety of the current cyclical bull market, though if it is broken, it will open up the lower support range of 9.5 to 11:

I was going to post some charts on bonds this morning, but there are too many and the topic is too involved so I'm going to write a separate post on that and post it tonight, but I'd just like to say that I've been working on the assumption that bonds are consolidating for a bounce here, but after a much closer look the picture looks bearish rather than bullish. On the 60min chart there is a bearish descending triangle, which gives a nice range to play while it lasts, but resolves downwards 64% of the time, which would deliver a very significant support break if it happens. Short term there's every reason to expect a bounce within the pattern though:

Very short term support on NQ has broken while I've been writing, and if we see further declines then we may well see a test of key support levels on NQ and ES. Those levels are 2300 on NQ and rising support at 2289. On ES I'm seeing strong support at 1284.
JBTFD I Guess (by Springheel Jack)

By -

Yesterday was a dispiriting day for the bear side. Not only was there no follow through to Friday's drop, which wasn't unexpected as a bounce was likely, but there were bullish breaks up on copper, EURUSD, GBPUSD and silver. The first three of those all made new highs and that weakens considerably any argument that we will see any bearish follow-through this week.

That we are still seeing some promising topping patterns is still the case though. On ES we seem to have a broadening top forming, and I'm looking with some concern at the top trendline, as to reach it we would have to break strong trendline resistance in the 1313 – 17 area. I've marked in two internal trendlines that look likely to provide resistance this week:

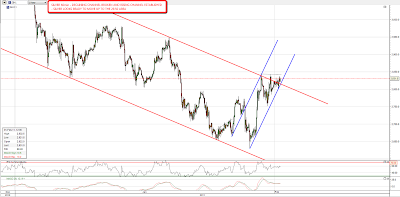
IWM has broken the rising wedge and is forming another broadening top. The broken trendline has already provided resistance and should be significant when reached again:

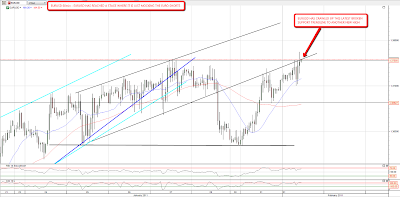
On EURUSD yet another promising reversal setup folded yesterday as EURUSD crawled up the underside of the (third recent) broken support trendline to make another short term high. It would be easy to get the impression that EURUSD is just making fun of the short side now:

I don't know how much immediate upside is left in copper now, though oil (/cl) looks likely to make 93.4, possibly after some helpful riots in Egypt today. Silver has a nice looking long setup here, having broken up from the declining channel yesterday and consolidated around the broken trendline overnight. A promising looking rising channel has formed that looks ready to take silver higher. At the time of writing at least silver is just above the lower trendline of that channel:

Dow Theory expects the Dow and The Transports index to make new highs together. If they don't you have a non-confirmation until the lagging index makes a new high as well. You often see such non-confirmations before significant highs. The Transports index ($TRAN) is lagging very badly at the moment and has not confirmed the latest highs on the Dow. It is a long way from a new high, though as I was looking at the chart I doodled in a small falling wedge that might get it there:

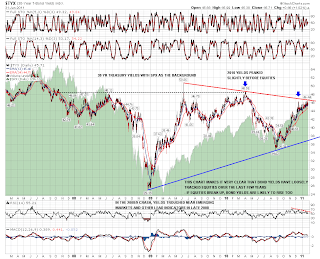
Probably the most thought-provoking chart I looked at this morning was the 30 year treasury yields daily chart. Long bonds look ready for a bounce that might or might not drag down equities with them. There's serious negative divergence on the daily RSI and yields have hit the resistance trendline on this chart, which I last posted in September I think when I was arguing that the likely effect to QE2 on bonds would be negative (the bond yields chart is the inverse of the bonds chart). Obviously that was right, but I don't see the juice there at the moment to break that declining resistance trendline without at least a pullback first:

I'm leaning towards us seeing a slow grind up on equities this week. I'm hoping we'll see some decent trendlines form along the way.

Inflation (by Runedge)

By -

I don't claim to be an expert on inflation nor will I give an opinion if we will experience inflation, deflation or both.  Prices on essential items are rising.  Prices on non-essential items are falling (home prices, flat screens, etc).  The chart below of the CRB Index shows the rise in input costs contrary to the CPI (ex food and energy) which the Fed constantly talks about as showing no inflation in our economy. Name one person who doesn't eat or drive.  Just one please.


If you manufacture anything your input costs are rising.  Whether it be oil to run a machine or flour to make bread, your input costs have risen significantly.  You have three choices.  You can raise your prices, lower your margins or reduce expenses.

Raising Prices:

The US economy is on fumes right now (government sponsored or shall I say debt sponsored). There is no velocity, no demand.  Sure you can raise prices on some items such as gas at the pump.  It's a commodity and we all need it, like it or not.  We will pay higher prices.  Other items it is hard to raise prices. Bread prices at the grocery store seem to be rising but not at the rate of grains.  Flat screen prices are falling and there is no chance of passing along higher costs.  

Lower Margins:

If you can't raise prices then your margins are instantly lower.  If you are a public company you need to manage the bottom line.  I used to own a small business.  If I was in a position where my margins were being squeezed, I would live with it for a while but once it started hurting my own pay check I would have to begin making tough choices.

Reduce Expenses:

Public companies have to hit the bottom line and will lay off staff, cut back overtime, lower wages, etc. Sure they can cut back other fixed expenses but after two years of slow growth, those expenses must already be scaled back somewhat.

Considering those three options, I see two outcomes playing out in our future.

Outcome 1:

The economy improves, allowing input costs to be passed along to the consumer.  The result will force employers to raise wages.  The scary side of this scenario is there is so much money in the economy right now that any velocity will truly make us a Weimmar republic.  Prices will skyrocket  and the Fed is in no position to stop it.  They cannot reduce their balance sheet for the simple fact the capital losses would be massive.  They would need a bailout from the Treasury.  Imagine that concept.  

Outcome 2:

The economy continues to stagnate as it has the past two years.  Considering that 20% of those lucky enough to be employed are working part time this scenario seems pretty reasonable.  Under this scenario rising prices cannot be passed along.  Sure some will such as gas as we are seeing now and basic needs such as groceries.  Under this possible outcome, companies will be forced to reduce staff and or wages, further reducing overall demand.  Those prices that do get passed along will literally choke off any remaining demand and push the economy back into recession.

Food riots are breaking out across the globe.  China is faced with a very real and serious inflation problem within their country.  I suspect this issue is going to come to a head far faster than June when QE2 ends and QE3 possibly begins.  When the cost of milk doubles in price and wages stagnate, Bernanke will have far more to answer to than a 60 Minutes interview.  

I still can't believe he said he can raise rates in 15 minutes.  How naive does he think we are? Apparently very.  

Submitted by Runedge.  If you would like to read more please visit my blog - Ultra Trading

Mixed Picture (by Springheel Jack)

By -

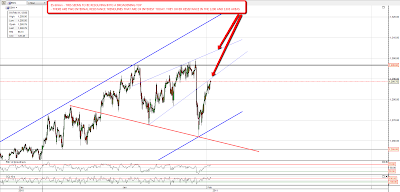
There's a mixed bag looking at my charts this morning. Copper and precious metals are looking weak, oil and forex strong, and equities could break either way. I'm looking for a move up to (finally) hit the ever-receding upper trendline of the rising wedge on the ES daily chart, and I might well get it if equities break up today. That target is now at 1293.5 ES. ES has formed what may be a bull flag since the high yesterday, but it is NQ that is looking really interesting this morning. On NQ a strong resistance trendline was broken a couple of days ago, and I've seen that referred to as a rising wedge, though if so, it isn't high quality. Since then however NQ has formed a smaller and much higher quality rising wedge, and it is that wedge that should define the direction of equities today. Rising wedges break up 30% of the time normally, but on the performance of these wedges within this strong uptrend of the last few months I'd put the probability of an upward break at more like 50%:

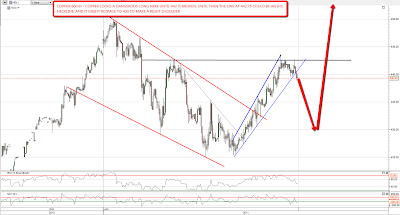
Silver is looking weak this morning and may be forming a large and rather ugly H&S. Copper failed at the neckline of a possible IHS yesterday and has given back most of yesterday's gains overnight. It was looking a bit stronger when I capped the chart below but I have marked in the possible retracement that we might see to make a right shoulder for the IHS:

Oil is looking very interesting today. as it is in a slightly messy but decent quality rising channel. There's a good chance of a double trendline support hit in the next two or three hours followed by a likely further move up. That would be an attractive long entry:

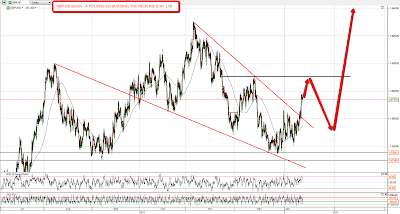
USD currency pairs are looking pretty strong overnight and I'm expecting some more dollar weakness. The GBPUSD rising wedge broke up yesterday and the obvious next target is the possible IHS neckline at 1.59. If  USD has topped, which is possible, I'd then expect to see a retracement to make the RS and then a move to a new high:

EURUSD is a tougher call here as the short term chart doesn't offer much in the way of usable trendlines. In the absence of those the next obvious serious resistance is just over 1.34. That's still 250 pips away at the time of writing, but it is the obvious target on this move up if equities break up too:

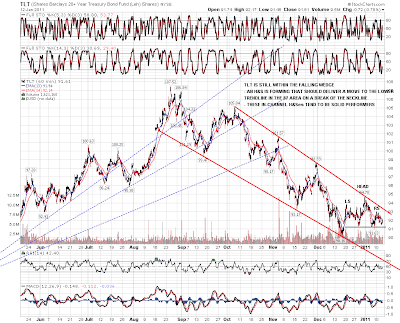
I was looking at the TLT chart this morning and the falling wedge that it has been moving down within since the announcements of QE2 last August. I have some serious doubts about whether it will make the next downside target as it would necessitate treasuries moving through a support level that would in all probability confirm the end of the 30 year old bull market in bonds. I'm expecting that confirmation in the next few months, but it is a big support level and I'd expect at least a pause there. Encouragingly I'm seeing an H&S form from the hit of the falling wedge upper trendline, and these in-pattern H&Ses are solid performers in my experience. If the neckline breaks with confidence I would therefore expect the next downside target in the 87 area to be hit:

Of all of these I'd pick NQ and oil as the most interesting plays today as both have clear support levels that should be hit early on and both have good odds of a strong rise after that support hits. In both cases a break of support would indicate more downside and they would become strong short candidates: