Slope of Hope Blog Posts

Slope initially began as a blog, so this is where most of the website’s content resides. Here we have tens of thousands of posts dating back over a decade. These are listed in reverse chronological order. Click on any category icon below to see posts tagged with that particular subject, or click on a word in the category cloud on the right side of the screen for more specific choices.

Wobbling Bulls (by Springheel Jack)

By -

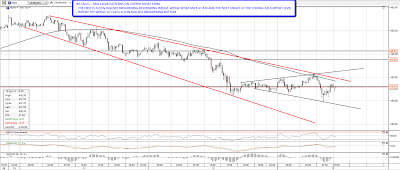
The market hasn't moved down much overnight, but three things have happened that have shaken my confidence that we're going to bounce soon. Firstly ES has broken down through the strong support level at 1305 that held yesterday and Tuesday. I have a declining channel on ES that may now take it down well below 1300 and there is a possible H&S forming as well:

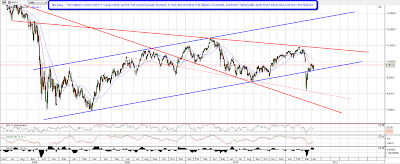
Secondly copper dropped to my 426 target that I posted yesterday morning and has dropped below it to 424.55. That isn't a big overshoot, but it may well be a significant one, and copper is on the verge of a major support break here. If copper futures go below 420 and close there then my next target would be in the 360-70 area, which is a long way down and would augur very badly for equities over the next few weeks. Here's the big picture on copper on the five year daily chart:

The importance of this level is a bit clearer on the one year chart:

Thirdly, of the other key indicators I'm also concerned about what I'm seeing on EURUSD, which broke above the rising wedge on the daily chart the other day. I said last week that this was either a break up or an overthrow, and EURUSD had held the broken trendline as support until last night. Overnight however it has broken back down into the wedge, increasing the probability that the break up was an overthrow. There is good resistance turned support at 1.428 and wedge support is at 1.423. A break of wedge support would be very bearish:

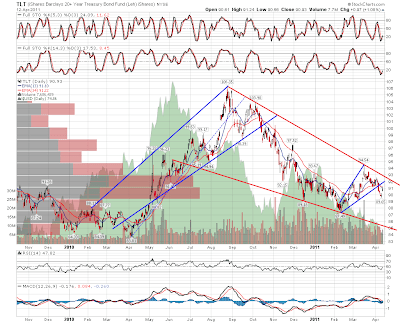
I'm watching bonds to see whether TLT can break declining resistance from the high last August. There's no cause for alarm yet but resistance isn't far above:

If copper and EURUSD break down, and bonds break up, the outlook on the bull side will start to look very doubtful. There are however some very good support levels on SPX that the bears will have to get through before the outlook turns very bearish and the first is at 1300 SPX. After that there is also very good support at 1285 SPX with the lower trendline of the main SPX rising channel in the 1280 – 1285 area as well. If we see a close below that, then we would then be likely to see the March lows broken in my view:

Looking at the NQ daily chart a diamond top may be forming. If this continues to form then I'd expect to chop around for a few more days into the end of the diamond, but a break down from a diamond top would point to the 2000 NQ area. Definitely one to watch:

I was looking through a lot of individual stocks yesterday and saw quite a number of leading stocks, AAPL particularly, that are at key support levels. I'll post some of those tomorrow if I have space on the post. This does underline however the importance of this area for the bull case. A failure here would be extremely significant. I'm leaning long for today, but without much conviction.
Top versus Pullback (by Springheel Jack)

By -

A good question was asked yesterday, and the question was why I and others were regarding this as a pullback rather than a move down from a major top. There are several reasons why that is. Firstly equities are clearly in a strong cyclical bull market, and the bull trend has to be given the benefit until demonstrated otherwise. Secondly this bull market has been fuelled and boosted to a very significant extent by negative real interest rates and, much more importantly, quantitative easing on an vast scale. QE2 doesn't finish until the end of June, and equities didn't top for a month after the end of QE1 in March last year.

I'm expecting equities to struggle after the end of QE2, but I'd be surprised to see a major top much earlier. Thirdly the pullback we've seen so far is still within the normal limits that we would expect to see for a pullback within a bull wave up. There are some worrying signs that this may go further, but no serious lines have yet been crossed as yet, and there's no great reason to think that they will be.

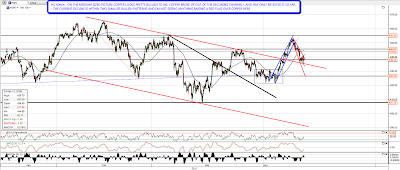
In terms of bull/bear indicators copper broke up from a declining channel a few days ago, and that was very bullish. Copper's retracing now, but hasn't done more than retest the upper trendline of the broken declining channel. The current retracement is also within two bullish (albeit weakly bullish) patterns, suggesting that it is just a retracement. That may change, but that's where copper is now. Here it is on the 60min chart:

Looking more closely at copper on the 15min chart you can see the two bullish patterns for the retracement. I'm expecting a fairly big move on a break up though the targets are only 453 for the wedge and 450 for the broadening bottom.  :

Looking at other indicators I've been watching bond prices, and there was a serious chance that a major low had been made in February. As you can see from the TLT daily chart though, the rally failed at declining resistance from the high last August, and while that trendline holds the presumption has to be that the move up was a rally within the greater downtrend. As bond prices are fairly strongly inversely correlated with equities, that still supports an ongoing equities uptrend:

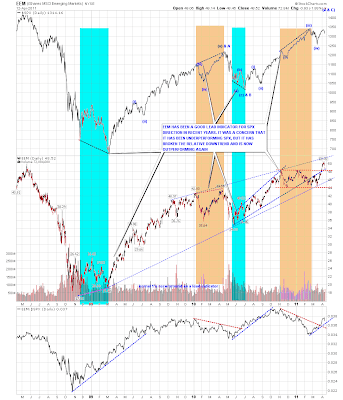
I also watch EEM as a lead indicator for equities, and there as well we saw a bullish break up in the couple of weeks. The current retracement has only retested the broken trading range ceiling so far:

On SPX I've mentioned a few times that the obvious target for a pullback was the daily 20 SMA, and we hit that yesterday and closed back above it. There's nothing remarkable about that so far and in any case there is strong support just below in the 1300 – 1305 SPX area. If we see a close below there that would look considerably more bearish:

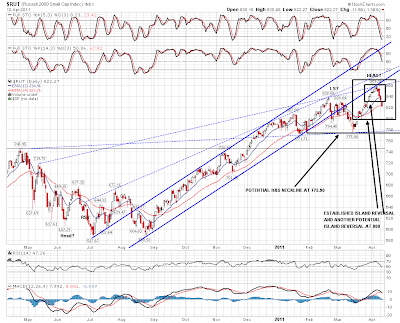
Now that's not to say that there aren't some worryingly bearish charts here. The Russell 2000 daily chart is a concern, as there is a clear island top there, and an obvious target in the 800 area where a larger island top could also be established. There's also a potential HS pattern forming if RUT makes it back to 775.90. As yet there's no reason for real concern though and looking at the premarket, RUT could well negate the current island top today by moving back above it:

Overall there's not a lot to see on the bear side on the bigger picture so far, and I'll only be looking harder at that if we see SPX move back below 1300. Until then this just looks like another dip to be bought.

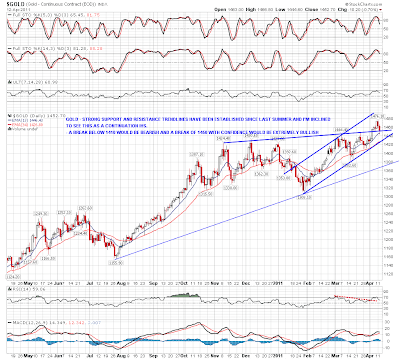
The last chart for today is the gold chart. I posted the strong resistance trendline, and possible continuation IHS neckline a couple of weeks ago, and here's the updated chart. Gold had a significant pullback this week, but so far the broken resistance trendline has acted as support. We'll need to see a close below that trendline to raise a potential warning flag for a significant pullback there:


Key Level on Australian Dollar (by Springheel Jack)

By -

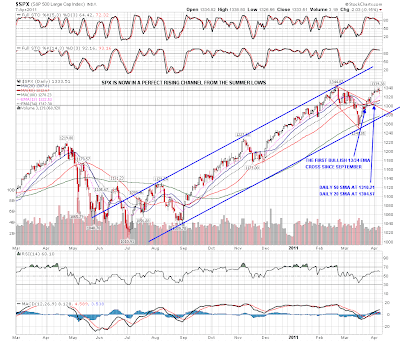
Another day of sideways chop yesterday, and SPX has built up a worrying series of topping candles. These don't always signal a trend change, but they do that much of the time, and that is a real concern here until overhead resistance is broken. Here it is on the SPX daily chart:

To add to the worrying technical picture, the Russell 2000 broke down from the recent rising channel yesterday, and that is a warning signal to consider seriously:

On the bull side NDX bottomed yesterday at one of my support trendlines and it might well hold there

I have mixed feelings about equities here and there is a real risk that we are seeing a double top on SPX if it can't break up from here soon. Copper has broken up very convincingly but if SPX just chops sideways until copper reaches the potential IHS neckline at 4.55 that would be a warning signal. As it is copper is still some way short of there, though it has broken 4.45 with confidence and looks likely to reach 4.55 next. I won't post the copper chart today as I already have seven other charts I'd like to post, and yesterday's chart still covers it well, but if HG/copper should retrace to 446, that should be a nice long entry level with a target at 4.55.

The US dollar had another bad night, and is now below 75.5. EURUSD has now reached the upper wedge trendline in the 1.44 area and we might see a reversal here:

The really interesting forex chart today though is AUDUSD, where AUD is hitting a four year rising wedge upper trendline intersecting with another 18 year support / resistance trendline. If we are going to see a reversal on AUDUSD anytime soon, this is the place. Here's the setup on the weekly chart:

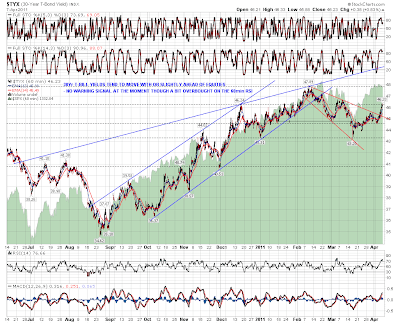
I was looking at 30yr treasury yields this morning for a directional clue on equities. That tends to trend up or down with equities, but sometimes weakens ahead of them. I'm not seeing any reason to think these are about to reverse seriously, though they're obviously overbought on the 60min RSI:

The last chart of the day is the very interesting chart for the Nikkei. I had a look at that yesterday after a talking head on Bloomberg suggested that Nikkei might be a long term buying opportunity. Looking at the chart, I'm inclined to agree, as the Nikkei has recovered and retested the broken rising channel lower trendline. As long as that trendline holds the Nikkei's looking pretty solid. :

I don't expect a serious equities reversal here, and I'm not really expecting to see one. There are some worrying signs of weakness though, and until ES and NQ break up through 1338 and 2350 respectively, there's definitely some reason for short term caution on equities.