Slope of Hope Blog Posts

Slope initially began as a blog, so this is where most of the website’s content resides. Here we have tens of thousands of posts dating back over a decade. These are listed in reverse chronological order. Click on any category icon below to see posts tagged with that particular subject, or click on a word in the category cloud on the right side of the screen for more specific choices.

Unfinished Downside (by Springheel Jack)

By -

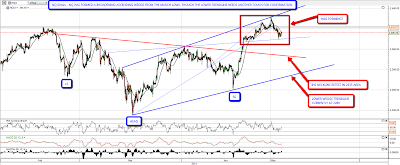
I started looking at the charts this morning assuming that we'd see a bounce on equities. That might happen, but the cast of the charts is pretty bearish looking so we'll see. I've been redoing my 60min charts on ES and NQ and the overall situation looks pretty clear on both. First is ES where there's an almost perfect rising channel from the March lows and I've also marked in the big IHS in case we see a neckline retest today:
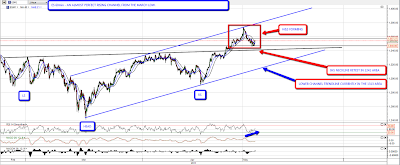
The key levels on the main ES rising channel chart are the neckline retest in the 1241 area, and the lower channel trendline in the 1313 area. There's also a little H&S forming on that chart that I've blown up below to have a closer look at and the target for that pattern would be in the 1320 area:

On NQ the rise from the March lows has taken the form of a broadening ascending wedge and I've added in the downsloping neckline IHS on NQ as well. The key retracement targets on NQ are the IHS neckline retest in the 2335 area, and wedge support in the 2280 area:
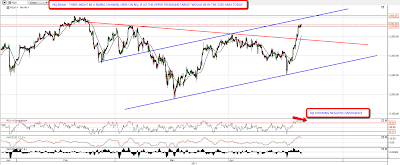
There's also a little H&S forming on the NQ chart. It isn't as easy on the eye as the ES equivalent but it's well worth noting. These two patterns give the short term charts their rather bearish look this morning:
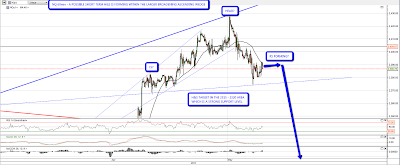
Obviously we're seeing a broad-based pullback in commodities at the moment, and I posted the oil chart a couple of times last week to highlight the possible double top that might be forming there. Oil then made a higher high slightly over 113.5 resistance and has since retraced to short term rising support in the 110 area. It might bounce here, but if it breaks down I'm looking for a retest of support in the 96 area:

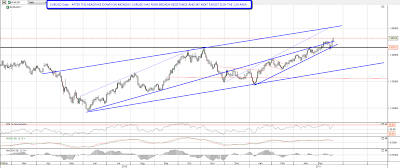
The case for a USD low is building in this area. Everyone has more or less written it off, which is bullish, and several currencies are now falling against it. What's holding it down is EURUSD strength, so I've had a look at that this morning to see if I can detect any signs of weakness. Looking at the daily chart though I'm not seeing any reason for EURUSD to reverse here, unless it is for a short term retest of broken resistance in the 1.4625 area. The obvious reversal area for EURUSD is in the 1.506 to 1.518 area. It may not make it of course, but I'd be reluctant to short it before it either makes it there or breaks support convincingly:

There's a very strong argument that treasuries have already made an important low in January, and they have risen to test a very important resistance level both in recent months and in the May 2009 to May 2010 period. If they break 124 and hold it then the treasuries rally is on, strange as it seems that anyone would wish to buy these. History suggests that it would be best to wait until resistance is broken before playing this as this could be the top of a trading range that might last a few months longer:

I'm leaning short today on the basis of the H&S patterns on ES and NQ. These are both strengthened by the larger setups on ES and NQ, though any bearish setup has obviously been higher risk for the last few months

Time to Buy Treasuries (by Duuuuuuuude)

By -

QE 2 is ending in June.  It would probably help your trading to recognize what affect this program has had in various markets you might invest in.

In the chart below, I have outlined the effects the Quantitative Easing programs have had on various asset classes.  It is easy to recognize the beneficiary of easy money.  Looking ahead, I expect these asset classes to continue to work in a similar fashion.  These asset classes behave in a particular way with stimulus, and without stimulus.

Correlated Assets
Looking at how strongly correlated US Treasuries are to Quantitative Easing, I would not want to own TBT here unless  for some reason treasuries break down here.

Bonds and Yields

ES Tests February High (by Springheel Jack)

By -

At the time of writing ESM1 has reached the February high to the tick at 1337.75 and is testing it. We may well see a new high today. After having a careful look at the continuation IHS that has formed I've redrawn the neckline sloping upwards slightly, so that's slightly higher at 1339.5. The 60min RSI is overbought and showing negative divergence so we may well see some retracement today or Monday and the obvious target for that retracement would be broken resistance at 1319. Pug's called this move very well and is expecting a wave peak in the 1340 – 1344 area, followed by a retracement into 1324 SPX, so that would fit my expectation very well:

NQ has led the rally from the Monday lows and has risen an amazing 130 points since then. I have a possible rising channel with resistance in the 2395 area, which is slightly below the February high which was at 2402.5:

The dollar is crumbling badly as various currencies have broken up against it. That supports the bull case here which looks very powerful. EURUSD has now broken up through resistance with confidence and my next target is slightly over 1.50:

AUDUSD has also broken rising wedge resistance and my next target is in the 1.11 area. The target for the broadening formation that broke up in September last year has now been met, but there's no sign of a top for AUDUSD here:

Vix broke below the 15 support level that has held since mid-2007 and may drop quite a bit further if the break holds:

So all is well with the world. Equities and commodities are set to make strong new highs while the US dollar is being beaten to death with the Fed's printing press. There's something missing from the picture though, and that's a falling bond market and rising bond yields. Bond yields have been highly correlated with equities in this bull market and the consolation prize for bears from a big new wave up was always going to be a rise in bond yields that broke the 26 year declining channel on TYX. The top of that declining channel was tested in February, and bond yields then reversed with equities. So far though, the bond market is holding up and yields are still well below those February highs. I'm expecting that to change, and if it doesn't then a strong move up in equities here would diverge markedly from bonds. That channel resistance is solid however so we'll have to see how that goes:

There are a couple of odd things about this rally up from the Monday lows so far. Bonds are holding up as I said, and the Russell 2000, the Transports index and Financials look weak. The bull case looks strong however after this amazing move up since Monday and I'm expecting that we'll just be buying the dip as usual once new highs on ES and NQ are made and confirmed. A couple of things to mention are the Easter holiday trading stats from the Stock Trader's Almanac, which are well worth noting. The trading day before Good Friday has been up on Nasdaq 14 of the last 16 times, and ten straight times since 2001. The post-holiday Monday however has worse stats, down 16 of the 20 between 1984 and 2003, though it has been up 6 of the last 7 since then. Thanks to Cobra for those stats on the Monday after Good Friday.

The move down on Monday with the confirming equity bearish trendline breaks on EURUSD, copper and bonds was just a particularly impressive bear trap it seems.  Many were fooled by it, including me, and there was a heartfelt post about it by a futures trader called Chris Johnston that echoed what many of us have been thinking this week. Definitely worth a read and thanks to my friend bullethead for posting the link for me.

Major Trendline Breaks (by Springheel Jack)

By -

I posted charts on TLT, copper, and EURUSD yesterday, pointing out that they were all testing important trendlines that, if broken, should indicate major trend changes. They all broke yesterday. I thought that TLT might be saved by the S&P announcement yesterday, but having pulled back below the trendline by the open, it broke up through it in the afternoon:

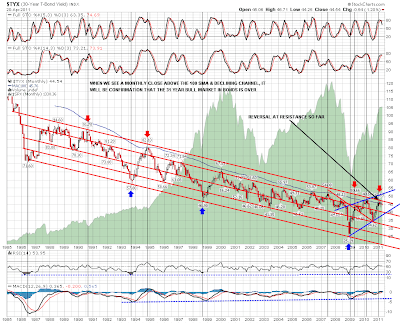
This should be followed by a big bond rally. It makes sense that we would see that here as the recent highs on 30 year treasuries tested the 26 year old declining channel and the trendline was rejected. That's a shame for the longer term bear case, as there could be no better way of bringing current US policies to a close than seeing interest rates set firmly on an upward path, but it is what it is:

Copper broke down yesterday, and here's the daily chart showing what a significant break down this is. I have some support in the 410 and 400 areas but my main target is the 365 support level, which is also a potential H&S neckline if it's going to retrace further:

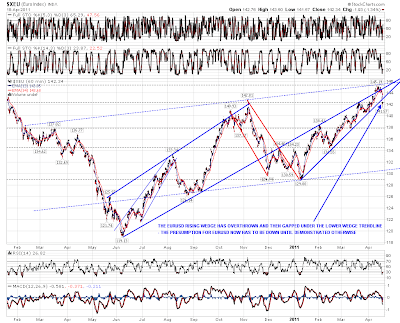
The trio of major breaks yesterday was completed by EURUSD, which gapped below the support trendline on the rising wedge that has formed since the last low at 1.29 in early January. Harder to put a target on the EURUSD retracement, but the technical target is back to that January low, and as the wedge overthrew, this wedge is unlikely to turn into a rising channel:

Taken together all of these breaks on bonds, copper and EURUSD augur badly for equities, with copper and bond yields particularly tending to track equities closely. My primary scenario is now that the February top on SPX was a major top and that it is now unlikely to be broken for a few months. We're also now coming into the seasonally weak May to November period of the year and this is a logical point to see a retracement on equities. Shorter term we still have two valid H&S patterns of the three that I posted yesterday morning, and they are the large IHS with the neckline at 1337, and the smaller H&S with the neckline at 1300. I'm taking the smaller H&S less seriously now as ES has broken back up over the neckline, though I'd only discount it altogether if ES gets back over 1315:

Equities are bouncing today and the logical targets on SPX are the 50 and 20 DMAs at 1315.25 and 1319.30 respectively. A break back above these with confidence would be bullish but until then they are the key resistance levels here:

I posted my daily gold chart a couple of weeks ago showing the very strong resistance trendline at 1450 and saying that a break above it would be very bullish. Since then gold has broken that trendline, retested it and is now testing the 1500 level. I wouldn't put any money on 1500 holding:

The bulls are on the back foot now and the technical picture favors the bears. The bulls still have the potential  IHS, but the odds on it playing out have worsened considerably.  The bears need a close below 1300 SPX and the bulls need to close back above 1320 SPX. I'm leaning towards seeing a bounce today but it may not get far.

At The Cliff Edge (by Springheel Jack)

By -

(Preface from Tim: I'm going to be – – yes – – quite busy today. More than normal, even. So posts might be a bit fewer and farther between than usual. Be strong.)

Friday looked like a pretty solid bullish reversal at first glance. ES broke back up through 1315, and the Russell 2000 crossed back over the island gap of the island reversal. Yet another potential HS pattern formed on ES, a smaller IHS in the right shoulder of the larger IHS. This is nothing unusual and supports the larger pattern:

There are now three HS patterns forming on ES of course, as there is also an H&S with the neckline at 1300. You sometimes see clusters of H&S patterns forming like this. That gives us a series of targets and key levels today. For the small IHS with the neckline at 1318.5, the right shoulder target would be 1305. A move to 1300 would kill that small IHS, though nor the larger one, and bring ES to the neckline of the HS pattern with the neckline at 1300. An hourly close below that would look very bearish. A break up through 1318.5 would indicate to 1337, at the neckline of the large IHS:

Nothing so far on ES looks incompatible with a bullish reversal at 1300, but looking elsewhere there are some very worrying signs from a bull perspective. The first thing to look at is EURUSD, where support at the broken rising wedge upper trendline was broken on Friday. EURUSD has now returned to test the lower wedge trendline and the strong support level at 1.428. If EURUSD breaks down through both, then EURUSD may well have made a major top at 1.4525. That isn't necessarily immediately bearish for equities though, as the last EURUSD high was several months before the equities top a year ago:

The next three indicators are much more immediately bearish. The first of those is the Vix, which has returned to test the December to February lows. This level is very strong support on Vix, and has held four times when tested since July 2007. The last test of this level was over a couple of months between December and February, but it is a warning signal for bulls that Vix is now testing it again:

The other two indicators are at major support / resistance levels, and breaks through those levels might well signal that the February highs were a very major interim top on SPX. The first is on bonds, which bottomed a couple of weeks ahead of the SPX top last April, and bottomed again in early February last year. The rally on TLT since April failed at declining resistance from the high, and retraced nicely, but on Friday TLT returned to declining resistance, and looking at the action on Treasury futures overnight, TLT is likely to break that declining resistance trendline at the open. If so, that would be a very serious topping signal for equities:

The other indicator is copper, which like bonds, tends to peak and trough slightly ahead of equities. Copper didn't follow equities up on Friday and is still sitting at support. If that support trendline breaks, as with bonds, it would be a serious topping signal for equities, though unlike bonds copper support has held in the futures market overnight so far:

I'm very concerned about the picture on EURUSD, Vix, bonds and copper, and we're very close to seeing a major technical breakdown across the board this morning. That's not to say that equities won't rally from here, but there is a very real possibility that this will go the other way, and a relatively small move for the bears here would strongly suggest that the February high was a major interim top that will hold for several more months.