Slope of Hope Blog Posts

Slope initially began as a blog, so this is where most of the website’s content resides. Here we have tens of thousands of posts dating back over a decade. These are listed in reverse chronological order. Click on any category icon below to see posts tagged with that particular subject, or click on a word in the category cloud on the right side of the screen for more specific choices.

Crumbling Support (by Springheel Jack)

By -

There's a lot of positive divergence on the 60min charts, but the overall picture is looking distinctly bearish to my eye this morning. ES has gone slightly below the 1279 support level overnight and if that breaks with confidence then there's little support that I'm seeing until the ES and SPX retest the March lows. I'd be looking first at the SPX March low at 1249 rather than the ES low at 1241, though we might see the lower target hit:

On NQ we are approaching the 2250 level which saw important lows in January and April. There's decent support there and I have some weak channel support there as well. If that breaks then the path is open to retest the March low at 2188:

On TF the next obvious target is slightly above 780 where there's decent trendline support. Below that there is very strong support and another potential H&S neckline at 770:

One thing that is looking particularly bearish this morning is copper's break down from the sloppy rising wedge that it has formed over the last month. That may well signal more downside on equities as well as more downside on copper. I'm seeing strong support on copper at 395 and the rising wedge target is at 385:

Vix is still trading within the range established after the March lows on equities. I was struck this morning by an observation I read that significant lows are generally made after a big spike up on Vix, like the one we saw in March. We haven't seen that spike yet of course:

One thing that is showing a lot of positive divergence, apart from USD, is bonds. Looking at this TLT chart the obvious next move would really be to trendline support in the 92-3 area. That would be bullish for equities of course. There's no reason though to think that equities can't make a final move down before that happens but it's something I'm bearing in mind:

The case for a strong bounce here this week looks much weaker this morning in my view, and I'm leaning much more towards seeing a further flush downwards this week towards the SPX March lows, where there is very strong support. There is a lot of positive divergence of course though, and equities are already looking very oversold so shorts should be cautious here.
Looking Fairly Bullish (by Springheel Jack)

By -

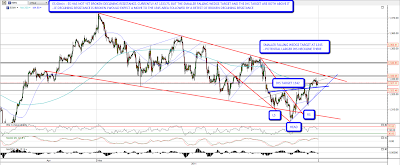
Looking at the charts this morning they're looking fairly bullish to me. On ES a test of declining resistance from the high seems likely today.A break of declining resistance would be extremely bullish with the big falling wedge indicating back to the high. A small IHS and smaller falling wedge are targeting the 1340s and strong resistance, along with a larger potential IHS neckline, is at 1345:

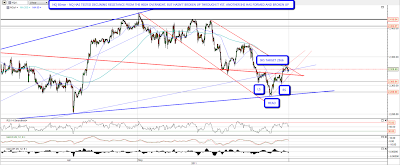
Declining resistance on NQ is already being tested, with another small IHS targeting 2366. Strong resistance, and a potential larger IHS neckline is in the 2370 area.

Declining resistance was broken overnight on TF, though the trendline wasn't as strong as the ES equivalent. Another little IHS is targeting the 844 area, though there's a resistance area on the way at 839:

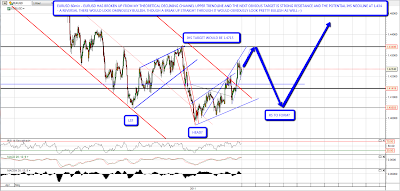
EURUSD broke up through the potential channel resistance trendline I posted yesterday morning and the obvious target is now 1.434 for another potential IHS neckline.

Copper has broken the resistance levels at 412 and 416 I posted the other day. there's some possible resistance at 419, but otherwise I'm seeing the next likely target at 426.8:

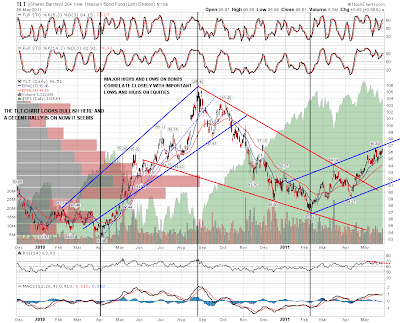
Bonds tend to move inversely to equities, so I thought I'd have a look at the TLT chart this morning. Sure enough, TLT is making a double top with negative RSI divergence at rising channel resistance. A fall to the 91-2 area looks likely next, which would be bullish for equities. It's worth noting on this chart that the last channel high on this TLT chart was just before the March low on equities:

Not much for the bears here so far but I do have one ray of hope for the bears to show this morning and that's a possible H&S pattern forming on SPX that vandalay pointed out to me the other day. I'm not sure what I'd give for its chances here but the neckline trendline is undoubtedly perfect:

I'm leaning bullish here but we could see some retracement today. If so, I have short term rising support on ES at 1318.5. Today will be a low volume pre-holiday day, which probably favors the bulls. Tuesday will be the last trading day of the month, which is distinctly bearish statistically. It might be that a bullish breakout might wait until Wednesday.

Eye on UltraShort Treasury ETF (by Mike Paulenoff)

By -

My near and intermediate-term technical work on the 10-year yield is warning me that the correction in yield off of the Feb 9 high at 3.74% is nearing completion ahead of the initiation of a new, powerful upleg.

Let's notice that all of the action during the past two weeks has carved out a "falling wedge" formation within the lower portion of the larger, corrective pattern that has dominated the price action since early February.

The falling wedge formation usually represents a consolidation prior to one final price plunge that concludes the corrective period (in this case, from the Feb 9 high).

Right now, I am expecting one more bout of weakness that presses yield to 3.03% before its reverses to the upside in a big way. It is with the foregoing in mind that we are bullish the ProShares UltraShort 20+ Year Treasury ETF (TBT).

TpJA1bSDt
Originally published on MPTrader.com.

Whipsaw Market (by Springheel Jack)

By -

Well volatility is back and this whipsaw market has been confusing many of us, including most definitely me, though I've still been calling the turns pretty well. To add some clarity I've discarded all my usual trendlines and charted up various indices from scratch this morning on another computer. What I'm seeing from that is pretty interesting.

On the ES chart I can see no reason yet to think that the bullish trend up from March is in any trouble. Given the length and power of this move up from last July, and the fact that the obvious topping area for this move was always going to near the end of QE2 in June/July, I'm inclined to give the bull trend the benefit of the doubt until demonstrated otherwise. We're not there yet. The touch of rising support from the March low on ES yesterday wasn't perfect, but it was close, and this is a gently narrowing rising wedge, or ending diagonal in EW speak, which would be normal for a final stage move in a big wave up. The wedge has three touches on either side and is therefore fully formed, but it hasn't broken down yet, and the upper trendline target would be in the 1390-1400 area if immediate resistance is broken:

110513_ES_60min_Rising_Wedge
NQ has been divergently bullish on this latest retracement, and I'd generally read that as bullish for equities as a whole. I can't think of any good reason not to read it that way here as well. A strong support trendline has been established at the recent lows and NQ is now testing overhead resistance again:

110513_NQ_60min_Trendlines
I'm not as happy with my trendlines on TF, but support has been established and the overhead resistance trendline looks solid with the exception of the small overthrow in late February:

110513_TF_60min_Trendlines
The direction of bonds is very important for equities, and I've had another careful look at the setup there. What I'm seeing is that there is a declining channel from the high last August that isn't yet broken. The current retracement to test channel resistance is also in a perfect gently rising channel, and the next obvious move is down, which would be supportive of equities here:

  110513_ZB_Daily_Declining_Channel
The overall direction of USD isn't as important to equities as bonds. Equities and USD rallied strongly together from December 2009 through to the equities top at the end of April 2010. EURUSD (55% of the USD index) may have made an important interim top here, in which case I'd expect a move to rising support in the 1.35-6 area. Looking at the weekly chart though, there's still a good case that this recent move down has just been a retest of broken declining resistance from the 2008 high. If EURUSD can close below that trendline on a weekly basis, there will be a good case for a bigger move down towards support:

110513_EURUSD_Weekly_15_Year_Trendlines
I've also been having a fresh look at the oil chart. I've been calling the turns on oil very well in recent weeks, calling a top at 113.50 with a target at 96, then a bounce to 106 that only made it to 104.50, and a return to 96 which we say again yesterday. What now though? Looking at the weekly ten year chart this latest retracement may simply have been a retest of broken resistance. If that trendline is breached then I'd expect a move back to support in the mid-80s, with an expectation that support there should hold. Apologies for the strange candles in 2009 caused by bad data from my futures people:

110513_CL_Daily_Ten_Year_Chart
We're all watching the show with great interest on silver, but for overall precious metals direction I tend to use the more staid gold charts, which are easier to chart with tradeable trendlines. The best timeframe to take at the moment on gold is the six month daily chart I think, and the beautiful broadening ascending wedge from the January lows. That could break down at any time and that break would be bearish, but the current uptrend is intact until that wedge breaks down and I won't be getting excited about the short side on PMs until then:

110513_Gold_Daily_BA_Wedge
In the short term equities are hitting resistance this morning and I'm expecting a dip that I'll be buying. Until the lows this week are broken, JBTFD is still the higher probability trade in my view.

Blogger is down this morning so this is not posted at my blog today and I'm seriously considering switching my blog to WordPress.