Slope of Hope Blog Posts

Slope initially began as a blog, so this is where most of the website’s content resides. Here we have tens of thousands of posts dating back over a decade. These are listed in reverse chronological order. Click on any category icon below to see posts tagged with that particular subject, or click on a word in the category cloud on the right side of the screen for more specific choices.

Debt Ceiling Carnage (by Springheel Jack)

By -

Well we got the bounce I was expecting yesterday, but it wilted before it cleared 1315.5 on ES, and new lows have been made overnight. I'm very sorry to see that the TF declining channel didn't make it through the night. A sad loss, as navigating this decline just got significantly tougher. A shorter term declining channel of decent quality is still in play however:

On ES the apparent declining channel is actually a gently broadening wedge. As with the others ES is now showing very significant positive divergence on the 60min RSI:

There's a sort of falling wedge forming on NQ but the trendlines aren't strong enough to take much notice of this yet. NQ is still holding above 2350 on an hourly close basis:

EURUSD held the 1.427 area yesterday and retested broken wedge support. Overnight 1.427 has been broken on an hourly basis however and I'm expecting more downside from EURUSD:

Looking at the DX 60min chart, the likely shape of the EURUSD decline looks clearer. There's a nice looking falling wedge on DX that has broken up and retested, and a small IHS that has formed with the target at 75.60. Short term this DX chart is looking very bullish, and subject to the geopolitical rumblings this week and the GDP figures this morning, more upside for DX looks very likely today:

I posted the rising wedge on gold futures yesterday morning and that wedge has now broken down and retested. I'm expecting a reversal down for gold here, which would fit well with the move up on USD that also looks likely:

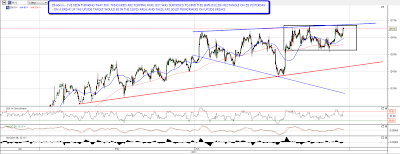
I've been looking at the 30yr treasury futures, and it is astonishing how well these have held up in a news-heavy week where the news has been a battle to avoid defaulting on US debt. ZB has been consolidating in a range since May and looking at the chart over the period, what this most resembles is a continuation IHS. I've drawn in arrows to show what I mean. IHSes often fail at the neckline of course, and this pattern may not complete or play out, but if it were to play out that would suggest more trouble ahead for equities:

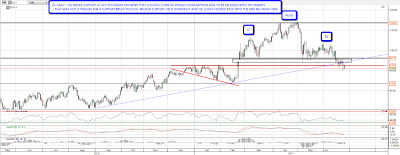
The last chart for today is the daily SPX chart. This shows the progress of the possible H&S that is forming, and that SPX is currently at the bottom of the bollinger bands. Most importantly it also shows the daily 200 SMA, which held as support in June. That's in the 1285 SPX area now and that is the key support area for today if we see more downside:

There's plenty of positive divergence on the 60min charts, but overall the setup looks bearish for equities today. I'll be watching big support in the 1285 SPX area as very key. A break down from there would look very significant.

UUP Breaks Up (by Springheel Jack)

By -

A shorter post than usual today as I need to make my children some lunch and there's not honestly much to see today on the shorter term equity futures charts apart from to say that ES, NQ and TF have now all hit oversold on the 60min RSIs.

The possible H&S on SPX is still in play, though the right shoulder went a bit higher than I would have liked, and the equivalent patterns on RUT and NDX are looking very stretched (RUT) and trashed (NDX). NDX made a new high of course so whatever is happening there, that was not a right shoulder for an H&S pattern. I've added the bollinger bands to this SPX chart and would note that I'd be looking for support at the middle bollinger band in the 1300 area:

The overnight low on equities might well be it for this retracement. Looking at 30yr treasury futures on ZB a large megaphone is forming. Technically this would be a broadening top I think, a directionally neutral pattern that is a poor performer on breakouts, but within the pattern the next downside target would now be in the 120-1 area. If ZB heads there then I would normally expect equities to bounce while it did so:

The really interesting things to watch here though in my view are USD and EURUSD. EURUSD is now approaching rising support from the 2010 low. This is a very key support level and a break below it would look very bearish:

It is the UUP chart that looks really interesting for USD though. I posted the big falling wedge there a few weeks ago and also marked up (black dotted line) a symmetrical triangle forming at the bottom of that wedge. Yesterday morning UUP gapped up to close over both. This is a very bullish development and suggests strongly that USD has bottomed and is now in a wave up. If so that will limit gains on equities but not prevent equities from moving up. It's worth remembering that USD bottomed five months before the equities high in April 2010:

On Friday I forecast a retracement into today or tomorrow, and on Sunday night I gave an H&S target at 1304. ES troughed at 1295.25 overnight and has recovered 20 points since then at the time of writing. Looking at ZB as well, the overnight low on ES was a very good candidate for the low this week. I'm cautiously long equities here.

Devil’s Advocate (by Springheel Jack)

By -

I'm still doubtful about this move up, mainly because I'm skeptical about seeing a powerful new wave up in the absence of more QE. That's something we haven't yet seen in this current bull market and while it could happen, as I said I'm still somewhat skeptical. However today I am going to suspend my disbelief, and argue the bull case here purely from the technical perspective.

First off I'll quickly show where equities are on the 15min charts. The SPX rising channel had already broken down before I did my post yesterday of course, and the rectangle that was forming has evolved into a little IHS that would have a target in the 1350 area. That pattern isn't fully formed yet of course:

On NDX the rising wedge / channel broke yesterday and a little broadening ascending wedge has formed as NDX has continued to inch upwards. The target for that bearish wedge in the 2355 area might well  be a decent retracement target as and when NDX breaks downwards:

On RUT the rising wedge / channel also broke down yesterday and another broadening ascending wedge is forming:

On to the bull case then. Obviously I was expecting some retracement in a number of areas this week and we haven't seen that retracement on equities. However we have seen it on EURUSD and ZB (30yr treasuries). On EURUSD my chart is already somewhat out of date as EURUSD has now broken down to the 1.425 level through the support level it seemed to be bottoming at. However it has now retraced over two thirds of last week's powerful move up, and unless it is on the way to a new low, then there isn't a great deal further it can go while remaining a retracement. EURUSD and equities moved together strongly last week, and equities have merely consolidated while EURUSD has retraced. In the last two years that combination has been characteristic of a strong bullish wave up on equities:

30 year treasuries also moved strongly (inversely) with equities last week, and has been retracing since making a short term low on Friday. Since then the retracement has peaked at a strong resistance level and a strong rising support trendline has formed, which has broken down while I've been writing this. This would be a typical start for a big new move down, which would normally accompany a move up on equities:

Silver is more loosely linked to equities of course, but always worth watching regardless. Somewhat to my surprise silver has broken back up through the broken support trendline from last August, and has now broken up through my secondary target. Looking at that in more detail on the 60min chart, the declining channel from the daily chart is actually a falling wedge, which overthrew slightly at the low and has now broken up with a target at 38.78, not far below serious gap resistance in the 40 area. The rise has stalled for the moment at a potential declining channel upper trendline, but after the overthrow through the lower channel trendline the odds of that resistance holding long are considerably lower. The pattern setup for silver therefore looks strongly short term bullish here, which again fits with bullish equities:

There's also been quite a bit of talk about a reversal here as part of the formation of cup and handle patterns on ES and TF. NQ has overshot the target already. There are some issues with this and they are as follows. There would be no uptrend leading into the cup, which is a problem, and the cup would have two handles, one on each side, which would make it more of an IHS. There may be a cup forming, but if so then the obvious reversal would be at the 2011 highs, which would deliver the uptrends into the pattern, and get rid of the surplus handle on the other side. Once ES and NQ break the February highs therefore, the natural targets are the 2011 highs, and we might not see a retracement worthy of the name before we get there. I've marked up the ES 60min chart with my analysis of this possible setup and my pattern data as usual comes from Bulkowski's outstanding reference site which you can find here

Given that oil and copper have also broken up, the outlook for equities on an intermarket basis is therefore looking fairly bullish across the board if EURUSD turns, which admittedly it is showing no sign of doing at the time of writing. I'm increasingly doubtful about seeing a retracement on equities here. If we are to see one before we retest the 2011 highs, we should see it at the retest of the February highs.

Mixed Signals (by Springheel Jack)

By -

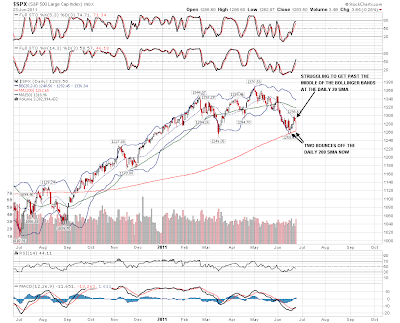
The action on equities looked pretty bullish to me yesterday, with the SPX falling from a higher high, and bouncing at a higher low from the daily 200 SMA, which was hit for the second time in recent days. SPX then recovered much of the losses from the morning and the previous day. Here's the daily SPX chart with bollinger bands to show those bounces, and the failure so far to get past the middle of the bollinger bands at the daily 20 SMA:

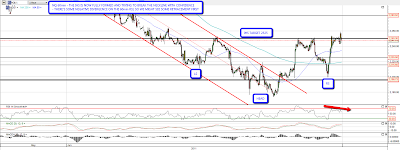
On NQ the IHS that we have been watching form this week is now complete, waiting only for NQ to break resistance at 2250 with confidence. That hasn't happened yet and might not happen today:

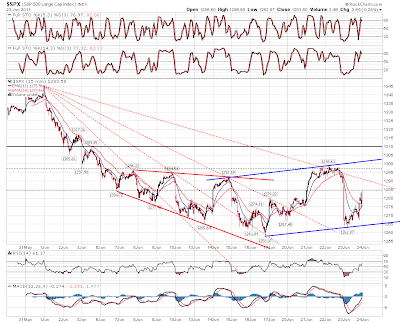
On the shorter term SPX chart a wide and shallow rising channel may be forming (thanks to Nugie for pointing these out on SPX and RUT yesterday afternoon):

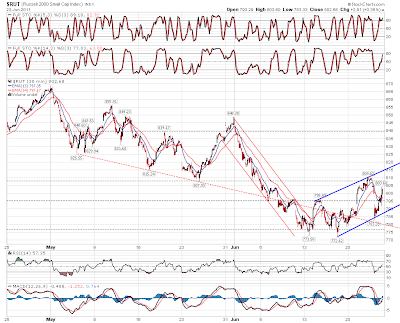
A similar rising channel has formed on RUT:

On equities this is all therefore looking fairly bullish, but it's when I look at other markets that I'm seeing a few flies in the bulls' soup today. EURUSD obviously had a big fall and less big recovery yesterday. It's fallen back somewhat overnight, but the chart that drew my attention today was the UUP daily chart with the huge year old fully formed falling wedge. The EURUSD move down yesterday poked through the upper wedge trendline which is often a sign that the wedge is about to break. If EURUSD closes a day near yesterday's lows at 1.414, then that wedge will break:

The key trendline on silver at the moment is the rising trendline from last August which was hit for the fourth time yesterday and held. Overnight though silver has tested it again and has penetrated the trendline on an intraday basis. If that trendline breaks on a daily closing basis then the way is open for silver to fall to test support levels lower down. July is a weak month for silver generally and the average summer silver retracement bottoms at the end of July. If the trendline breaks we could well see a sharp downward move.

Oil fell yesterday as it was announced that strategic reserves equivalent to 17 hours of world consumption will be released over the next month. That pushed /cl through 92.5 support and that broken support held as resistance overnight. The technical picture on oil already looked precarious and I'm expecting to see oil back in the 80s very soon. I have a variety of targets for the move down ranging from the early 70s to the mid 80s, but there's decent support in the mid-80s, so that's the first target:

I've been writing about a possible interim top in treasuries for a few weeks now, and I'd expect them to fall if equities rally strongly. I was a bit surprised therefore to find a 69% bullish rectangle on the futures yesterday. The target on a break up would be in the 128'05 area and these tend to be solid performers on breaks up, with Bulkowski giving 80% odds of the upside target then being reached. Definitely something to watch:

On these last four charts it's important to note that support on silver, and resistance on UUP and ZB, are still holding so far, even though it seems they may not hold much longer. If these trendlines break though then four separate markets that are all correlated with equities will be breaking in directions that suggest weakness on equities. I'll be keeping a close eye on all of these. 

Short term the equity bulls are holding their ground, but need to break overhead resistance to deliver the multi-week rally that I've been expecting. The key levels in my view are that NQ must get above 2260 and hold above it, and ES must do the same with 1293 and then 1300. Fridays and Mondays have been fairly bearish lately, so that might have to wait until Tuesday.