Slope of Hope Blog Posts

Slope initially began as a blog, so this is where most of the website’s content resides. Here we have tens of thousands of posts dating back over a decade. These are listed in reverse chronological order. Click on any category icon below to see posts tagged with that particular subject, or click on a word in the category cloud on the right side of the screen for more specific choices.

Adieu JBTFD (by Springheel Jack)

By -

Well the Vix closed up yesterday so there was no Vix buy signal (for equities). So much technical damage was done yesterday in any case that a buy signal here would have to have been treated with extreme skepticism in any case:

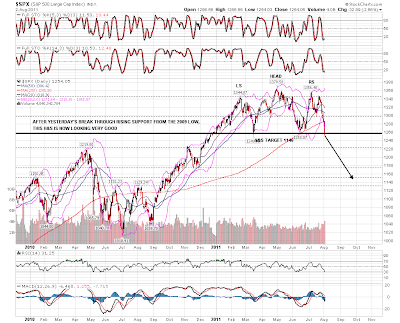
On SPX the rising support trendline from March 2009 was broken with a lot of confidence and the H&S pattern that was forming on SPX has now been completed. If we're going to see a bounce before this H&S starts to play out seriously it will probably be here, at strong support and after an amazing series of down closes that hasn't been matched since 2008. If we see a continuation down then next big support is in the 1220 area:
I've dusted off the larger bear patterns on the other indices and on RUT we have another big H&S with the neckline being tested now. If we see a move down directly from here then I'm seeing the next serious support level at 740. The H&S target is 676:

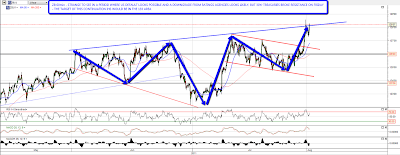
NDX has been the strongest of these three indices and there is no H&S on NDX as a result. What there is however is a broadening top. I posted this two weeks ago and after some minor tweaks here it is. The next target should be in the 2175 area slightly below the June low:

There was an amazing move up on bonds across the board yesterday and I was surprised and sorry to see my lovely little rising channel on TLT broken. The IHS target I gave at 101.9 has not yet quite been reached:

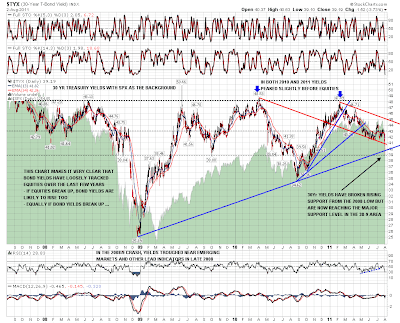
Looking at 30yr Treasury yield on TYX, the move down has broken rising support from the 2008 low but is reaching a longstanding and key support zone in the 38-9 area. If we're going to see a short term reversal, this is the likely place:
There were a lot of broken trendlines yesterday. Another that was broken was my four year resistance trendline for gold. I have a shorter term rising channel with resistance in the 1690 area:

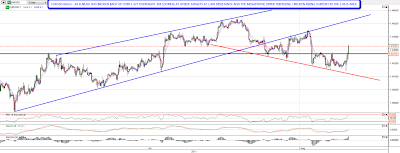
EURUSD has been tricky to call in recent days, but it has broken back up over the key 1.427 level again overnight and I'm looking at two short term upside targets. The first is at at the resistance level at 1.445 where the last move up failed, and the second is at the broken rising support trendline in the 1.4525 area. You can see that since it broke the rising wedge a few days ago it has formed a sort of megaphone:
Massive technical damage was done on equities yesterday, and I think it is more than likely now that the cyclical bull market since March 2009 is over. I had expected this in a year or so, though like many others I wondered aloud how long this cyclical bull market could last in the absence of QE. The answer would now seem to be that it could not be sustained without QE, but failure now leaves the possibility that the Fed might try to turn equities around in the same way they did in 2009, with massive additional money printing. Subject to that, the next few months on equities should be dominated by the bears. 

In terms of the immediate outlook eight consecutive down closes on Dow have not been seen since 2008 and major support levels are being hit at the moment. The key level for today is 1257, which was a key level at the June lows. If ES can close an hour above there then I'm expecting a decent bounce here. An important upside target on NQ would then be the 2319 support level I highlighted yesterday morning as a serious warning signal if it was to break.

At The Precipice (by Springheel Jack)

By -

I've been bullish so far this summer regarding this move down, and I'm still bullish, though we're close to a level where I would switch my outlook to bearish, on the assumption that the cyclical bull market since March 2009 was over. There are some good reasons to think that it might be over, as QE is at an end for the moment and may not be restarted, and austerity is starting in the US, albeit hesitantly. I think the bears are right about the overall economic situation and I was reading an excellent article by Mohammed El-Erian this morning on the world debt crisis that I thought summed up the overall outlook for the next few years very well. Well worth a read regardless of your views here.

If we are going to see a reversal here then we are reaching the key decision area on SPX. The key target here, and where I am expecting to find some support, is at rising support from the March 2009 low within what is most likely a rising wedge, but possibly a rising channel.At the least, I am looking for a bounce off this support trendline and that should be in the 1270 SPX area:

Now in an ideal world we would see a bounce off that support trendline, and then a move to wedge resistance slightly north of 1400 before this cyclical bull market ended. If we just saw a bounce before another try at the trendline, or if it breaks now, then the pattern to watch is the H&S forming on the SPX daily chart:

I've been expecting this move down to end in at least a strong bounce, and in part that is because NDX has been outperforming SPX on the move down rather than leading the move down as I would expect if this move was going to do serious technical damage. You can see from my comparative indices chart that NDX has outperformed SPX strongly since the last peak and NDXE, the equal weighted NDX, has also outperfomed SPX:

Normally at the stage where we were about to see a reversal I would have decline channels or patterns that would breaking upwards to signal the area where the reversal would start. I had some of those at the close on Friday, but they broke up yesterday morning, and then broke down again, so they can't be relied upon now. I do have a broadening descending wedge on the RUT 15min, and a break above resistance there should signal a decent reversal:

Watching the NQ chart might give a signal that was faster or better however. There's no pattern to speak of on NQ now, but the range levels that I gave last week still look very solid. The range levels to watch are 2319 and 2352. 2350 broke yesterday, NQ then bounced near 2319 support and then retested 2352 resistance overnight. An hourly close above or below these current range levels will probably give us the direction of the next decent move in either direction:

Other charts that look interesting day include the Vix daily chart where the Vix closed back inside the daily bollinger bands yesterday, thereby triggering a Vix Buy Signal (for equities). That signal isn't worth much unless it is confirmed and the confirmation requires that Vix close lower again today. I'll be watching for that confirmation and if we get it that has been a solid reversal signal for at least a decent bounce shortly thereafter:

The last chart for today is the TLT chart. I've been posting the IHS on the ZB chart (30yr Treasury futures) for the last few days, but the TLT chart puts that move in better context in my view. The main points to note from the TLT chart are the big reversal IHS with the neckline at 92.6 that has now made target, and the perfect rising channel from the February low. Disregarding the short term continuation IHS with a target in the 101.9 area, the obvious target is the upper trendline of the rising channel in the 100.3 area. If we were to see a fast move to that target now, that would most likely be accompanied by SPX breaking the major support levels just below:

The senate is voting on the debt ceiling deal at lunchtime today, and if that vote goes badly then I think it's safe to say then main rising support at 1270 SPX will be broken. It is generally assumed that it will pass the Senate however, and if so, then there is an excellent chance of at least a decent bounce from here. I would like to see a touch of 1270 SPX during market hours to deliver a solid trendline bounce.

Bullish Beginning (by Springheel Jack)

By -

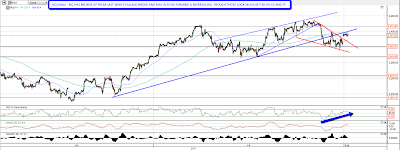
It's the first trading day of the month today, and as I have posted before, that means that the stats today are leaning bullish. With ES up over ten points from Friday's close at the time of writing that doesn't mean that we will see much more upside today though. On ES last week's declining channel has broken up and a reversal IHS may be forming:

On TF last week's declining channel has also broken up and a reversal IHS may be forming:

On NQ last week's falling wedge has broken up and a much less pretty reversal IHS may be forming:

Have we seen the short term low? Obviously there is still some very serious news risk here as the debt ceiling talks may break down again, but SPX held the daily 200 SMA again on Friday and I think there's a very good chance that the low is in. SPX still hasn't reached rising support from the March 2009 low of course:

NYMO is also looking promising here. I was looking at the NYMO chart a couple of weeks ago thinking that was strange that NYMO hadn't reached -80 since the Osama top in May and that was reached last week. That doesn't mean that the last summer low is in but it does mean that we should start looking for it:

Vix is key here as after closing above the daily bollinger bands three days in a row last week, a close inside the bollinger bands seems more than likely today. If we then saw a lower close on Vix tomorrow we would have a Vix buy signal (for equities). One caveat to mention is that the overhead gap I've been watching has not been closed as yet:

DX reversed downwards hard on Friday from the nice looking bull setup I was talking about on Friday morning. There's a bull setup on EURUSD this morning, though it would require a conviction break up through broken rising support there:

I'm astounded to see 30yr Treasuries rising this strongly in a period where US default looks possible, and a downgrade of US debt by ratings agencies looks likely. Nonetheless the possible continuation IHS that I posted on Friday morning is now fully formed, and ZB has broken up through the neckline. This is worth watching as a big move up on ZB would normally be seen while equities fall, as was the case last week. I'm expecting a rally on equities so I'm expecting this break up to fail. Something to watch:

I'm doubtful that we'll see a moonshot on equities from here, but I think that, debt ceiling negotiations permitting, we are close to seeing a short term low that should be followed by a strong rally. It seems very likely now that there will be a debt ceiling deal, but it's worth noting that any deal will most likely not be finalised until tomorrow, and very possibly after the market closes tomorrow. We might see some uncertain chop until the deal is done. Short term I'm watching support on ES at 1300 and there is strong resistance in the 1312 area.