Slope of Hope Blog Posts

Slope initially began as a blog, so this is where most of the website’s content resides. Here we have tens of thousands of posts dating back over a decade. These are listed in reverse chronological order. Click on any category icon below to see posts tagged with that particular subject, or click on a word in the category cloud on the right side of the screen for more specific choices.

Breaking Down (by Springheel Jack)

By -

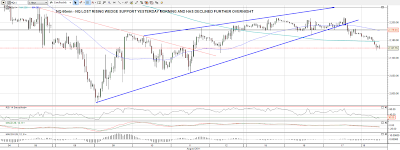
I've been warning all week that the nice bullish setup into the 1240 SPX area might fail as the main trend is still down, and it looks as though it has broken down with conviction overnight. The technical position might be recovered with a very fast and strong recovery this morning, but failing that the advantage is back with the bears. NQ cracked first yesterday and broke rising wedge support:
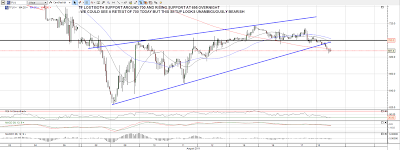
TF held the support zone yesterday but fell through it overnight. After a bounce at rising support which confirmed the trendline and has given us a second rising wedge on an equity index, the wedge then broke downwards. I'm wondering about a retest of broken supporting the 700 area in the morning session:
ES broke up yesterday morning but the breakout failed and fell back. 1180 support held during the day but was then lost in the overnight session. Rising support is in the 1156 area and a bounce there would deliver a third rising wedge. We might well see a bounce there, possibly to retest broken support in the 1180 area:

Bonds gave an early warning of trouble yesterday, with TLT having risen strongly for both of the last two days. TLT is within striking distance of new highs, which I'm expecting soon:

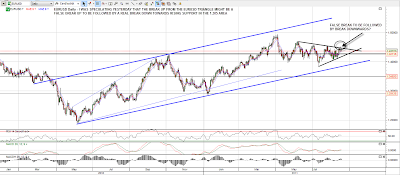
I was speculating yesterday morning that the break up from the EURUSD triangle might be a false break up before a real break down towards support in the 1.385 area. I'm still wondering about that today and if we are starting another move down on equities then I think that is more than likely:
The advantage is firmly with the bears today but we might yet see a strong bounce to test broken support in the 1178-80 area before dripping much further. The Gap Guy says that the odds for a gap fill today are good and while I think that's unlikely, we might well see a strong attempt to fill the gap. Kudos to Pug for calling the likely high in the 1200 area all week and he is targeting a retest of 1101 on his primary count.

Bonds Finally Ready to Ease Back

By -

It has been a breathtaking run for bonds, as seen here via the TLT fund. It bottomed at 92.52, around the time the Greek parliament saved Europe (ha! ha, ha!) From then, one might be seen as one of the most boring financial vehicles on the planet (after all, we're talking about a non-leveraged fund that trades in risk-free government securities………..), it rallied over 18% in just over a month (!!!!!!!!) To say nothing of the fact it pays a 4% dividend anyway.

But all good things must come to an end, and I think TLT has reached its technical target. Easing back to at least the upper 90s would make sense at this point, which would line up nicely with continued strength in equities as we prepared for the Short Of The Decade Event.

0811-tlt

Downgrade Monday (by Springheel Jack)

By -

What a difference a week can make. This time last week ES had made a bullish looking recovery over 1300 and most analysts were expecting a rally. A week on ES is down almost 140 points, the Vix touched 40 (more or less) on Friday and the weekend was most notably marked by S&P downgrading US debt from AAA (expected) and riots in London (unexpected). The riots in London, strangely enough, seem to have been sparked off by a known criminal being killed in a shootout that started when one London policeman accidentally shot at another London policeman. It isn't yet clear whether the dead known criminal was armed or, if armed, whether he ever drew his weapon. My father always used to say that policemen here had so little experience with guns that when they were armed, they were a serious danger to themselves and innocent bystanders.

Be that as it may I have a possible declining channel on ES that is suggesting that we may see another test of broken support in the 1215-1220 area today or tomorrow. I was suggesting on Friday morning that ES might peak there which it did. The H&S target on SPX is not yet made and if we do see a retest of the 1215-1220 area I'd be seeing that as a sell opportunity:

it's obvious that USD bottomed out a few months ago, and I think what we are seeing here is the most pathetically weak USD rally that I can recall. EURUSD is still trading in a range around the 1.427 area and broke up from last week's declining channel at the open yesterday before declining back to the 1.427 area again:

I think gold has replaced USD in the flight to safety trade this summer along with Yen and bonds which are the other usual flight to safety destinations. It is a mark of quite how weak this rally on USD has been that it has failed to make much headway against embattled EURUSD. Gold has broken up from the rising channel of recent weeks and is consolidating above it. I'm leaning towards a reversal here but we might instead see a break up from the channel with confidence:

I'm having trouble buying a bear market here. Government credit is still too good, austerity is only hesitantly beginning, corporate earnings have been so good that the P/E ratio here (reported earnings) is the same as it was in March 2009. Perhaps, but this could just be a short term panic. 30yr treasuries are now in an area where we would normally start looking for a high:

NYMO is very much in an area where we would normally be looking for a low or at least a serious bounce:

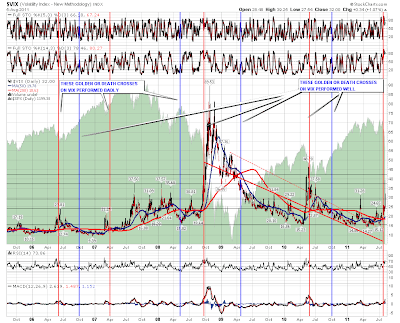
We've just seen a golden cross on Vix (daily 50 and 200 SMA cross), which is bullish for Vix, though the performance of these over the last few years have been hit and miss. There are four golden crosses apart from the current one on this daily 6yr chart. The first two were in the last bull market, and were failures as equity shorting signals. The third was in September 2008 and was a great success, and the last in May/June 2010 I'd see as a marginal success:

I'm leaning towards seeing a low with at least a decent bounce this week, though I don't have anything in the way of a reversal pattern on any equity index. The Fed is meeting tomorrow and it will be interesting to see what they come up with after the turmoil of the last week. Will they announce QE3 then or later this month? I think they might to try and head off recession in the US and panic in the equity markets. If so the outlook for USD and bonds particularly would look grim but equities might get another lease of life for a few more months of bull market.

Shocked and Awed (by Springheel Jack)

By -

You don't see a 99% down day very often but we saw one yesterday.SPX crashed through the very important support level in the 1220 area as though it wasn't there, and ES has traded as low as 1183.50 overnight. Wow.

We might see a bounce here. After a trend day you generally get at least a day or two of retracement. How far would that bounce go? Well a retest of the H&S necklines on SPX and RUT is starting to look like a long shot from here, and SPX might well now find that the 1220 S/R level that broke like tissue paper on the way down yesterday is now solid resistance today. I've been having a very careful look at the H&S patterns this morning and I'm happy that I have drawn the SPX H&S in the best way. That delivers a target at 1146 SPX, near the January 2010 SPX high at 1150:

The H&S target on RUT is more ambitious, and targets the 676 area, which was the key resistance area in the summer last year. I think that target will be made, though possibly not on this swing down:

As the strongest of these three equity indices there is no H&S on NDX, but there is a broadening top that I posted earlier this week. We have almost reached target on that, which I would put in the 2176 area. NQ is trading at 2190 as I write and I am wondering whether we'll see a hit of that trendline this morning. If so there is a decent chance of a bounce there:

I was watching in amazement yesterday as the bullish setup failure that I wrote about yesterday morning turned into yesterday's bull massacre. Vix finally filled the second gap from March that I've been watching since then and closed a long way above the bollinger bands:

NYMO is even more oversold now and what's worth noting on the NYMO chart is that there's almost always some positive divergence at a major low. The way that would generally work in EW terms is that you'd see positive divergence on the last wave down in a sequence. If we are looking at a 3 of 3 wave, and this sure looks like one, then waves 4 and 5 still lie ahead, once this current move can find a tradeable low. Would that wave 5 low be at the H&S targets? Maybe, though we're close enough now that it's hard to rule out the wave 3 low being there:

Looking at other charts this morning gold has almost reached the target I gave the other day. We've lost a lot of trendlines in recent days and this might well break too:

ZB has overshot the 133 IHS target I posted as a possibility last Friday when ZB was trading at 126'18. An amazing move in just a week:

The most puzzling thing this week has been the relative strength of EURUSD (and GBPUSD). The flight to safety plays this week have been gold, bonds, Yen but not USD. What gains USD has made have also been disproportionately due to the hammering that commodity currencies have taken. Whatever else, this is an interesting new development. I have a decent declining channel on EURUSD that is holding. Not perfect but reasonably good and it looks as though EURUSD should bounce a bit here today:

My feeling is that we should see a bit of retracement today. immediate resistance on ES is at 1201 and stronger resistance is in the 1215 area.