Slope of Hope Blog Posts

Slope initially began as a blog, so this is where most of the website’s content resides. Here we have tens of thousands of posts dating back over a decade. These are listed in reverse chronological order. Click on any category icon below to see posts tagged with that particular subject, or click on a word in the category cloud on the right side of the screen for more specific choices.

Smoke and Mirrors (by Springheel Jack)

By -

Well after all the anticipation, the Fed announcement yesterday amounted to little or nothing presented as action. Sure the Fed will roll over maturing treasuries and mortgage bonds but so what? With the Fed Twist program selling $1 of short term treasuries for every $1 of longer term treasuries purchased there will be no new money and in effect this is akin to supporting the housing market by not selling houses. The truth is that the annual market boosting QE pushes of the last two years have now been abandoned. That's a good thing as the markets can now find their natural levels without the effective Fed subsidies for equities that we saw in 2009 and 2010.

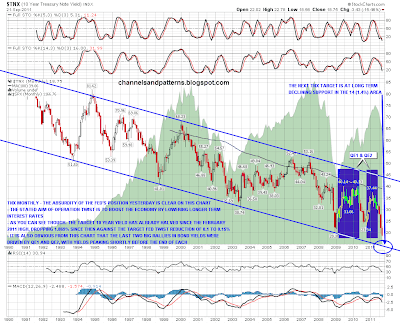
As for the apparent aim of Twist to reduce 10 year treasury yields by 0.1% to 0.15%, it is laughable. For starters 10 year treasury yields have halved since the February 2011 high from 3.744% to 1.875% at the close yesterday, so the target reduction is less than 10% of the reduction we have already seen this year. Why have rates fallen so much since February? Because QE2 was drawing to a close with no announcement of a QE3 that has now been ruled out for the time being by the Fed. Both of the big rallies in treasury yields that we have seen since 2009 were clearly driven mainly by QE1 and QE2 and died with them, as you can see from the chart below. This is a 20 year TNX (10 year treasury yields) chart and you can see that the obvious target now is in the 14 (1.4%) area:
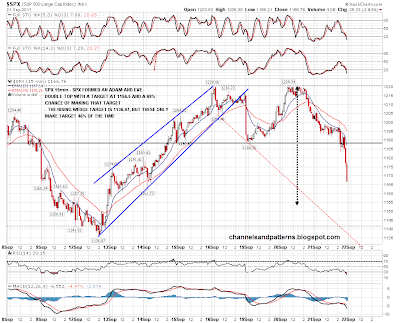
I'm going to do a broad spectrum post today looking across the main markets as I think we are starting another big move down on equities now, and I'd like to review the various interrelated market areas. I'll have a quick look at SPX though to identify the main levels that are important today. On the SPX 15min chart the double-top target is at 1156.05, which is likely to be made with ES trading under 1130 as I write this. The rising wedge target is at the last swing low at 1136.07 and that is a very important level today. If the next swing low is above 1136.07 then we might see another last push up before the next big move down begins. If 1136.07 breaks however then the chances are that big move down has already started. as usual I have taken my pattern targets and probabilities from Bulkowski's outstanding reference site here and the probabilities are marked on the chart:
On the SPX daily chart I've marked in the two key target levels for today. The first is rising support from the SPX low and the bottom daily bollinger band in the 1145-7 area, and the second is 1136.07 again:

Looking at the Vix I gave a bold target over 36 yesterday morning and it reached 37.32, closing at the high. As you can see from the chart this was somewhat more than a retest and if sustained today my next target is in the 38.5 area. Anything over 40 will suggest that new highs will be coming soon:

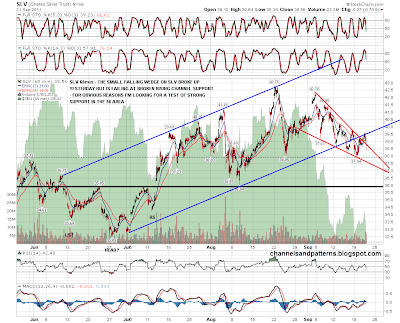
On precious metals the picture was complex yesterday morning with two competing scenarios. The first was a rising channel from the lows that I have posted often and posted last when it broke last week, but a smaller falling wedge had formed from the last high and that broke up yesterday morning. So far SLV has failed at broken rising channel support and unless that is retested and broken quickly then the broken channel is the pattern to watch. I'm looking for a test of strong support (and potential H&S neckline) in the 36 area, and if that is broken, then a test of the June lows:
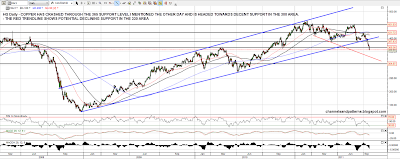
Bonds broke up on the Fed announcement yesterday, which as much as anything else triggered the waterfall decline in equities that we saw after the Fed announcement. EEM made a new low and copper has broken the important support level at 365 that I highlighted on Tuesday morning. I'm looking for a move on copper futures at least to declining support in the 330 area and possibly further to test support in the 300 area. As I mentioned yesterday, I'm expecting to see major lows on copper and EEM significantly before any major low on equities:
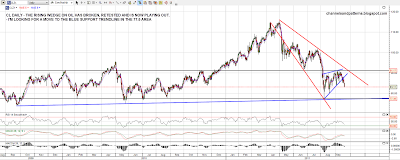
As I mentioned on Tuesday morning the rising wedge on oil broke down last week and has since retested this week and fallen hard yesterday. I have a strong support level and rising support in the 77.4 to 77.6 area and that's my main target area for this move down. The rising support trendline is a decent one so it may hold. a break below it would look very bearish and suggest a move into the 60s:
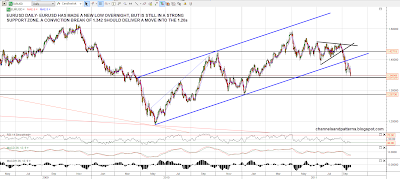
EURUSD is at an interesting level here but is still in a strong support zone between 1.342 and 1.35. A conviction break below 1.342 should deliver a move to the 1.20s, but until then this is still a strong potential bounce area:
The ES 60min RSI is now extremely oversold and we may well see a low made and a strong bounce start this morning. I hoping for a retest of the ES lows later on with positive RSI divergence for a long signal. How far might that bounce go? Topside would probably be broken support in the 1182 area, but it might fail before then.

The Big Picture (by Springheel Jack)

By -

Well I'm back from holiday now and my normal posting schedule will resume, though I was busy with post-return stuff this morning so today's post is late. That's not altogether a bad thing as I'd like to have a wide-angle look at the markets today to see what looks important across the various markets I follow. I do have one shorter term thing to mention though and that is that the ES low yesterday established a rising channel from the low last week. Until that breaks down there is a real risk that ES may move up sharply to the upper channel trendline, currently in the 1236 area:

Looking across the various related markets the general picture is coming over as pretty bearish. Copper has now broken rising (broadening wedge) support from 2008 with confidence on the daily chart and next decent support is at 365. Once that breaks, as seems likely, a test of 305 support is on the cards. A break up of this kind on copper would have been seeing as very bullish for equities. It's therefore hard to see how this major break down can be anything other than bearish for equities over the next few months:

EURUSD also looks bearish on the daily chart. Rising (channel) support from the 2010 low broke and was retested last week. I'm expecting a break of the last low at 1.35 too long and further declines after that:

The oil futures daily chart also looks bearish here The rising wedge that I posted a couple of times as it was forming has now broken down and the wedge target is at the August lows at strong 77.4 support (Dec futures). I'd be happier about that playing out soon though if CL has hit declining support from the high and it could be that we will see oil trade sideways for a few days until that is hit:

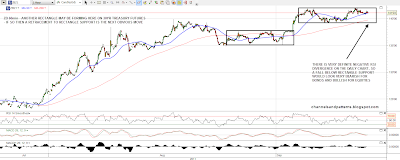
30 year treasury futures are more mixed here, but there are two rapidly closing trendlines that should deliver the next big move. The first is strong resistance at 142 which has been tested three times and could be a triple top. The second is rising support taken from the July high that is now in the 139'13 area. Rising support will meeting current resistance at the end of September so we will see a break up on down before then:

My last chart today is the AAPL monthly chart, which I've been posting on various timescales for the last eighteen months. I was wondering before the summer top whether AAPL hitting my upside target could mark the bull market top, but I think we've seen that already, though neither SPX or NDX has yet reached the technical bear market confirmation level of a 20 fall from the highs. I am now thinking that AAPL hitting target in the 430 area may signal the NDX high for the current move up and am watching with interest to see when that is hit:

I don't think we've seen a really major low on equities yet and after the current move up ends I think we may see new lows on SPX shortly afterwards. I'll be watching for a break of the rising channel on ES from the last low to signal that the current move is ending. Over the next few days we have a lot of things that could move the market a long way in either direction, with FOMC tomorrow, and seemingly almost daily crises and interventions in the Euro area as Greece and other PIIGS slide towards default. What I'm not expecting to see is an announcement of QE3, as rising inflation in the US would seem to rule that out, though we might see a smaller scale operation announced by the Fed this week that could lift the markets for a few more days.

Opex Friday (by Springheel Jack)

By -

The very nice declining channel on the SPX daily was pinocchioed on Wednesday and broke yesterday, opening up the possibility that we may rally further. The obvious targets if we see that would be the daily 50 and 100 SMAs in the 1230 and 1260 (by the time we get there) areas. If we see that my WAG would be that we would retrace from near here to the 1170-80 area before a move up. The stats for Fridays and even more so Mondays are bearish lately so I'd expect that retracement by the close on Monday. There is an RSI retracement target too and I've marked that on the chart:

Are we going to see that extended rally? Hard to say but I'm not seeing anything strongly suggesting a top on equities here. Looking at EURUSD I'm seeing a possible kiss of death retracement completion yesterday that would be bearish for EURUSD and equities:

On 30 year treasuries (ZB) I've been watching the current rectangle and that has been testing support hard. If support holds then the next obvious target is back to the rectangle top, which would be bearish for equities. If support breaks then I'd expect a deeper retracement on ZB and have marked in a possible target. A break down on ZB would be bullish for equities:

Last chart for today is something I was playing around with this morning, which is a 2 std dev bollinger band based around the weekly 65 SMA. A very nice long term indicator and my friend chewtonic suggested it might be improved further by increasing the 2 std dev band to 2.618 which works very nicely as well, with clearer top and bottom signals in bull and bear markets. The chart helps illustrate the importance of the resistance levels we are reaching again now:

It's opex Friday today so we may not see much action either way. The Gap Guy's tip for the day is that opening gaps in either direction wil most likely be filled. I should be back from holiday and posting again daily as normal from Tuesday next week. Everyone have a great weekend. 🙂

Broken Channels (by Springheel Jack)

By -

Yesterday started off very well for the bears. The SPX 60min rising channel broke down and the Vix broke the declining resistance trendline I posted. However, having spent most of the day below broken channel support SPX then broke back above it with confidence in the last hour. If we see more upside this week I have key resistance in the 1190 area and a break above would look very bullish. A break back below broken channel support slightly under 1150 would look bearish:

Looking round there are a couple of warning signals for bears here. 30yr treasury futures (ZB) may be forming another rectangle and the next obvious move is to rectangle support. If rectangle support breaks then the picture may become very bearish for bonds and bullish for equities as there is sharp negative RSI divergence on the daily charts:

The inverse correlation with precious metals is weaker, but it was interesting to note yesterday that the strong rising channel on SI (silver) in recent weeks has broken down:

Oil (CL) is looking unambiguously bearish, though it might rise to declining resistance from the high in the 92.5 area before the rising wedge breaks downwards. That would fit with a bounce here on equities first if that happens:

We saw a lot of technical damage yesterday. As well as the SPX and Vix breaks we also saw a pinocchio through rising support on copper that is a signal of future weakness IMO. The strong recovery later in the day was mainly about the rumors that China may intervene to support troubled Italy's bonds, and if that's true, then they may be interested in buying other kinds of overpriced paperwork from the PIIGS. If the rumors are confirmed we might see a strong follow-up rally in the short term It seems unlikely that China would be willing to invest in large amounts of dodgy paper at par though and I suspect that they will be unwilling to intervene on a scale that would do more than delay the inevitable for a short while. After this bounce plays out I'm still expecting to see equities at new lows.