



The tone on Friday was largely set by the resignation of Jurgen Stark from the ECB, the second German to resign this year after Axel Weber, previously widely tipped to have been the next head of the ECB, resigned in February. Jurgen Stark's resignation was ostensibly 'for personal reasons' but it is widely assumed that the resignation of both germans was primarily due to disagreement with ECB policy, and Jurgen Stark's resignation in particular to be in protest at the ECB's recent decision to start buying Italian and Spanish bonds.
Slope of Hope Blog Posts
Slope initially began as a blog, so this is where most of the website’s content resides. Here we have tens of thousands of posts dating back over a decade. These are listed in reverse chronological order. Click on any category icon below to see posts tagged with that particular subject, or click on a word in the category cloud on the right side of the screen for more specific choices.
Awaiting Panic Low in Yield (Paulenoff)
Remarkably, 10-year yield has declined beneath its December 2008 "crisis" low of 2.04% to a new "generational low" of 1.94% so far, as global money continues to flow into U.S. Treasury paper (despite its suspect rating downgrade in August).
Purely from a technical perspective, all eyes now are on the behavior of weekly RSI (momentum), which so far has NOT confirmed recent yield weakness from 2.30% and which we should consider a potential warning signal that 10-year yield is in its price capitulation phase.
Downside target zone: 1.78% to 1.46% within a panic low followed by a vicious, sustained upside reversal.
For those thinking that the UltraShort 20+ Year T-bond ETF (TBT) has to be a buy somewhere down here, well, yes "the buy" is getting closer, but my intermediate term work on 10-year yield argues that benchmark yield might still need to press 15 to 50 basis points lower in the days ahead, reflecting weak economic data, panic flight to safety, fears that Europe is disintegrating, etc.
Originally published on MPTrader.com.
Another Crossroads (by Springheel Jack)
With ES testing 1200 at the time of writing we are seeing the first significant pullback since the low last Friday, and looking at a number of charts here this might be a turning point of real significance. On SPX we now have a perfect rising channel from the August lows, which would make a break in either direction more significant, but also delivers a potential downside target in the 1140 area, which would retrace almost all of the gains since the low last Friday. I have some potential support at a broken declining resistance trendline in the 1190 area:

There are two charts in particular which are suggesting that we might see a very significant retracement here, and the first (weaker) chart is on EURUSD, where a sloppy triangle has formed in recent weeks. The upper trendline of the triangle is choppy, but the rising support trendline is solid, and the support break has me looking for a test of the main rising support trendline from the 2010 low at just under 1.40. The correlation with equities hasn't been very strong in recent weeks, but for what it's worth that would look bearish for equities:

The more interesting thing to watch however is the perfect rectangle that has formed on the ZB (30yr treaury futures) 60min chart. Under the circumstances this would be a rectangle bottom, with a 55% chance of breaking down, but these patterns are very high probability performers on a break up, and there would then be an 85% probability of making the rectangle target at 141'20, which would be a new high, and that would be very bearish for equities. ZB is testing rectangle resistance at the moment, and if ZB breaks up tomorrow, then I would expect SPX to break likely support in the 1190 area. If ZB retreats towards the bottom of the rectangle tomorrow however, then support in the 1190 area will most likely hold, and we might well then see another test of the upper trendline on the main SPX rising channel:

The other chart I'll be watching is the NDX chart, though the targets don't fit well with the SPX chart unless NDX falls far harder than SPX, which hasn't been the case so far. On NDX I'm looking at the open gap from Monday's gap up, and below that what should be strong support at broken declining resistance in the 2145 area. Any lower than that would suggest another test of the lows:

I'm leaning bearish here, but I'll be watching the ZB chart for confirmation. A break towards new highs on bonds here would look very bearish for equities.
Poised for GDP and Jackson Hole (by Springheel Jack)
The two big ticket news items today are obviously GDP at 8.30 and the text of the Jackson Hole speech by Bernanke that I understand is going to be released at 10am. Doubtless Bernanke has already seen the GDP figure and has adjusted his speech accordingly. The market is poised to break in either direction on the news this morning and my job today, as I see it, is mainly to highlight the key areas to watch to determine the direction of that break.
As I suggested they might, after the irritating BAC news spike near the open, equities broke down from yesterday's consolidation rectangle. Hopefully that didn't chop out too many people. The depth of yesterday's retracement clarified where main support lay on equities, as SPX, NDX and RUT all bounced at the Aug 19th highs. All three also formed ominous looking H&S patterns on those support levels that may play out today if the news disappoints. Here's how that looks on SPX:

As with the SPX version, the H&S on NDX is a bit light on the right shoulder, but valid nonetheless:

On RUT the H&S is sloping down and therefore not quite complete as support will need to break to complete it. I have marked the H&S targets on all three charts:

I've marked up yesterday's range and today's range on the ES 5min chart, giving 1153.22 and 1166.5 as the levels where a break with confidence should deliver a bear or bull breakout. This breakout should be very significant and deliver the main direction for the next few days at least. It's worth noting though that any break downwards particularly needs to be sustained into market hours to break support on the main index charts:

I'm watching Vix carefully today as on the 60min Vix chart there is a decent support trendline. If we see a bull breakout then that should break quickly to the downside and that would be a very bullish signal for the next few days:

I'm also watching ZB, 30yr treasury futures carefully here. ZB reversed back up before reaching my main target at 135, as I suggested it might yesterday morning. On the bear (equities) scenario we may be seeing a consolidation rectangle form that would now take ZB back to the highs. On the bull (equities) scenario a break back below 136 should deliver the main 135 test that I've been looking for and a break of that level would look very bullish for equities:

I haven't posted the copper chart much for a couple of weeks because it hasn't been doing much. It has been showing some signs of life in the last two days and has recovered the 410 level. I'm not sure whether that can be regarded as a bullish indicator yet, but a break of the next big resistance level today at 422 certainly would be. Something to watch if we see a break up today:

I've been posting the silver chart every day for the last few days and so far (buffs fingernails modestly) have called the action very well within what is now a simply beautiful rising channel. I've marked the current upside and downside targets on the chart and would that expect silver will probably move inversely to the equities break today:

I'm thinking that a break downwards on equities looks more likely today, and am expecting that GDP will disappoint and that Bernanke won't deliver a new QE3, but have no real idea what the news will be and today will be driven by the news. We'll see. I'll be doing Monday's post tomorrow as I'm away on Monday morning. Everyone trade safe today as this could be a wild one. 🙂
Jackson Hole Week Day 4 (by Springheel Jack)
Yesterday was one of those slightly spooky days when everything I post in the morning delivers. The ES IHS and the silver trendline break delivered so well I've saved both as textbook models of how these should look. Today is going to be tougher, and tomorrow morning of course we have the complete wild card of Bernanke's speech at Jackson Hole, which could spark off a big rally in the event that he announces QE3, or spark off a big decline in the event that he just waffles about the underlying strength of the economy. What do the charts say? Well it's a mixed bag this morning.
The first thing to note is that not far above there are some important unfilled gaps on SPX, NDX and RUT. Here's how that looks on SPX, with the gap at 1193.80 and important resistance at 1185:

On NDX the gap is at 2181.62, and I have important resistance at 2160:

On RUT the gap is at 704.03, and I have important resistance at 698:

Will the gaps fill? Perhaps, but the overnight action on ES doesn't look that promising and Steve Jobs' resignation as CEO of Apple last night might drag down NDX particularly. On ES I've been watching for a break of the very decent quality channel support trendline on ES and saw that overnight. The trendline was then briefly recovered to test yesterday's high and then lost again. ES is in a consolidation rectangle and that might still break up, but the trendline break still looks weak, and the bulls might well get a very nasty surprise today if ES breaks down from that rectangle:

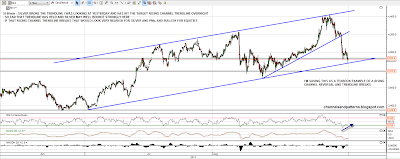
Silver has been a top performer this week, from a technical standpoint, and after the break down from the support trendline I highlighted yesterday morning made it precisely to my target channel support trendline at 3876 (on SI) overnight. This is the likely reversal area if silver is going to reverse back up and it has bounced there so far. I posted a chart on gold last night that you can see here showing support at 1725 (on GC) and gold went through it overnight to 1705. That wasn't bullish and you can see that there is also an unfilled gap on GC now much further below. Here's how the silver chart (SI) looks now:
Bonds fell hard too but are still well short of my support area and possible H&S neckline at 135. 135 would also be almost exactly at the 38.2% fib retracement of this last powerful wave up from late July. I still like 135 as my main target here, but ZB has consolidated overnight and is showing some positive divergence on the 60min RSI. It could bounce here today:

I have very mixed feelings about direction today and am watching the consolidation rectangle on ES for immediate direction. If it breaks up then I'll be looking for the gap fills on SPX, NDX and RUT. Even if that happens though there are now some real signs of weakness appearing and I'll be watching for reversal. If ZB (30yr Treasury futures) makes it to 35 I'll be looking for a reversal there. That might well happen if the gaps on the equity indices are filled. If silver breaks channel support then I'll be looking for another leg down on PMs which would most likely be bullish for equities. Copper and USD aren't moving much and so are giving little clue as to direction.
