Multiple daily hammer candlesticks on the indices yesterday, a sign of weakness and hesitation. The support trendlines on SPX and ES now also showing signs of wear and I think the topping process has started for the current wave up. That doesn't preclude new highs, but the writing is now on the wall for this move up in my view. On ES there was a definite break of channel support at the low yesterday and as I've said before, it is often the second break that is the decisive one. ES channel support is at 1286.5 this morning:
Slope of Hope Blog Posts
Slope initially began as a blog, so this is where most of the website’s content resides. Here we have tens of thousands of posts dating back over a decade. These are listed in reverse chronological order. Click on any category icon below to see posts tagged with that particular subject, or click on a word in the category cloud on the right side of the screen for more specific choices.
The Bull Case (by Springheel Jack)
I'm going to take a little time today to put the case for the new bull market from the October low. Negative divergences against equities here are very numerous, and for that reason bear market continuation looks more likely to me, but it would be a mistake to think that the bulls have no case here, and I'll be outlining what I see are the main planks of that case from a technical perspective.
In the short term support on the ES rising channel is clearly still holding, and until that breaks there's not much to see on the bear side here. The upper trendline of the channel is in the 1312 area, and ES has moved up an impressive nine points in the hour since I capped this chart to beat the last high. There might be more coming. Channel support is at 1282.5 this morning:
Potential Topping Area (by Springheel Jack)
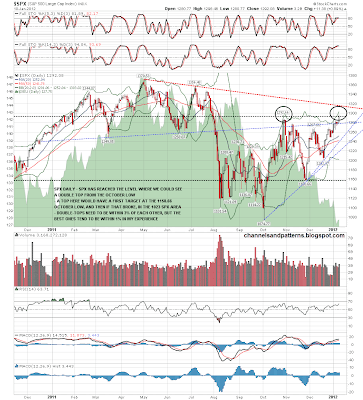
We've reached a potential topping area on SPX for both the current move up and potentially for the wave C top if this move from the October lows has in fact been a bear market rally. If SPX was to top here or close to here then that would deliver a double top from the October low, with the November low as the pattern neckline, and if SPX peaked yesterday that would deliver a target range for the next move down in the 1020-5 area. If SPX goes a few points higher that target would drop a few points as well. Here's how that looks on the SPX daily chart:
NQ and GBP-USD Patterns (by Springheel Jack)
There's still not much to see on SPX or ES in terms of trendlines and strong resistance on ES is obviously at 1280. While ES and TF were struggling last week however, NQ took leadership and kept pushing up while the others stalled. That has delivered an interesting setup on NQ, with a perfect rising wedge having formed since the end of the year. That would seem to limit upside unless the wedge breaks up and I have wedge resistance currently at 2366 and wedge support at 2347. Both of those are moving targets obviously:
Big Resistance Areas (by Springheel Jack)
ES held the 1260 area that I was seeing as major support yesterday morning, and is close to testing the 1280 high from the opening candle this week. If ES gets over there the real test is at the October high at 1283.50. We'll see whether that can be broken with conviction. If so that would look very bullish. A failure at or near the October high is potentially very bearish, as it sets up a double-top that would indicate to new bear market lows. I'm not wild about the trendline setup on ES at the moment, but there is a rising channel that I've marked on the chart;
I've marked up the trendlines on the 60min SPX chart as well. It's worth mentioning here that we currently have negative divergence on both the 60min RSI and the daily NYMO, which suggests a possible short term high in this area. The key SPX pivots here are the 1261 and 1292 pivots. the 1292 pivot is at the test of the October highs and is the next major resistance level. A break below 1261 SPX would strongly suggest that the short term high is in:
Looking at the NYA chart I've illustrated the importance of resistance at the October highs, which on NYA is also at declining resistance from the 2011 high. Declining resistance from the July high has broken and retested which is obviously bullish:
EURUSD broke strong support at 1.285 and the path is open to trendline support just over 1.26. There's a better trendline setup on the DX 60min chart however, as DX has formed a very nice rising wedge that I've posted before. DX is stalling at the last high at the moment but on a break up I have wedge resistance currently in the 81.8 area and wedge support in the 80.1 area:
There's another very nice rising wedge on CL from the last swing low. On the daily chart there is a potential double-top at 1the last highs that I'll be posting if CL breaks wedge support:
We're obviously at big resistance levels on SPX and oil as I've mentioned, but it's the setup on bonds that may be the key to what happens next. At the moment TLT has made what looks like a very nice double-top at 124 resistance and has since broken the rising support trendline from July. This is a very beearish setup unless TLT can break over 124 with conviction, and if bonds break down hard here, it's hard to see that happening outside the context of a big move up in equities. I'm leaning towards a continuation of the bear market here for many reasons, but this is a big warning sign that the bear market may be over. One to watch:
Obviously the key trigger for today is likely to be the employment numbers. On a break up over 1280, which I'm now watching as I write this, key resistance is in the 1292 SPX area at the October highs. There's big resistance there and I'll be watching that for any signs of an interim top.