

Slope of Hope Blog Posts

Slope initially began as a blog, so this is where most of the website’s content resides. Here we have tens of thousands of posts dating back over a decade. These are listed in reverse chronological order. Click on any category icon below to see posts tagged with that particular subject, or click on a word in the category cloud on the right side of the screen for more specific choices.

What Can We Expect from a Euro Rally? (by Closing Basis)

By -

Ok, so if the rest of you are anything like me, you're wondering where the market is going to go when it is at bullish extremes and screaming for a sell off/pullback, yet at the same time, it looks like the Euro is getting ready to rally and the US bonds getting ready to sell off which should encourage further upside in the indices.

 So, I threw together a 3yr comparison between the S&P500, TLH (10yr notes), and FXE (Euro ETF).  I've made some interesting and consistent observations so check it out.
(more…)

Trendline Voids (by Springheel Jack)

By -

I've called the last few significant interim tops and bottoms on SPX well, but those all had something in common that we're missing here, in that they all had clear trendline and/or pattern setups. As I have been grumbling almost daily for weeks in my morning posts, that is not something I'm seeing here as yet. We don't always get decent trendline setups of course, but often when I haven't been able to see them in the past that has been because they have not yet been established, as the trend has a lot further to go. That is something that is very much on my mind here.

Short term my SPX target at declining resistance from the 2011 highs has been hit, and this is a good place to expect at least a short term reversal. Immediate support is at the pre-market low at 1299.5 ES and that is a possible neckline for what could develop into a larger reversal:

(more…)

Bear Sentiment at 6 Year Low (by Springheel Jack)

By -

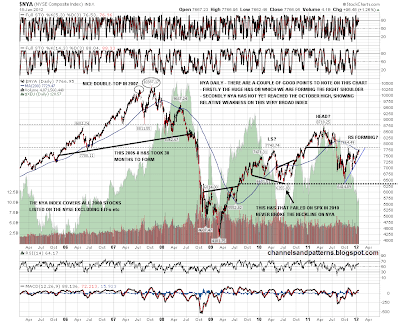
I'm going to be posting a lot of bullish charts today, so I'll balance that by leading with a bearish big picture chart. That chart is of the NYA Composite, which is a very broad based index including all stocks listed on NYSE, with the exception of some ETFs etc. On this chart you can see the huge H&S building that I have posted before, and it's also worth noting that NYA has not yet reached the October high, which is very strong resistance as it was also the H&S neckline for the topping H&S last year. A lot of analysts are changing to a bias that a new bull market is in progress but I'm not one of them yet, though I am most definitely weighing the evidence that it might be:

(more…)

Dead Cat Bounce? (by Springheel Jack)

By -

We've been having a lot of days where the low has been made about 10.30 and equities then rose for the rest of the day. Yesterday broke that with a bounce that petered out and then drifted downwards until the close. That doesn't mean that we've seen a top, but it is a change in the character of the market. On ES we have broken down from last week's rising channel into a shallower one. A break below channel support in the 1280 area would look immediately bearish. Channel resistance is in the 1308 area:

(more…)