Slope of Hope Blog Posts

Slope initially began as a blog, so this is where most of the website’s content resides. Here we have tens of thousands of posts dating back over a decade. These are listed in reverse chronological order. Click on any category icon below to see posts tagged with that particular subject, or click on a word in the category cloud on the right side of the screen for more specific choices.

Key Level on Australian Dollar (by Springheel Jack)

By -

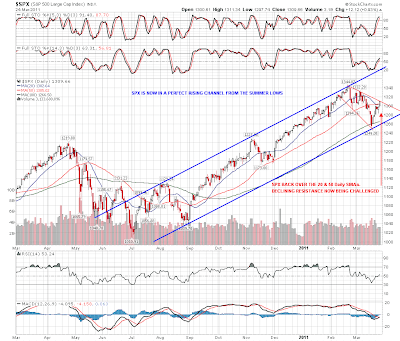
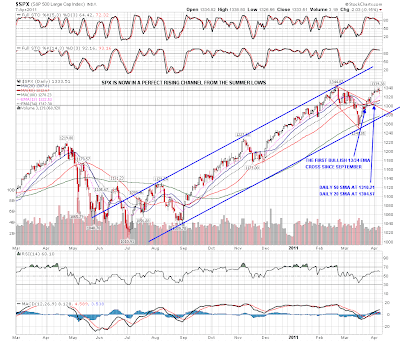
Another day of sideways chop yesterday, and SPX has built up a worrying series of topping candles. These don't always signal a trend change, but they do that much of the time, and that is a real concern here until overhead resistance is broken. Here it is on the SPX daily chart:
To add to the worrying technical picture, the Russell 2000 broke down from the recent rising channel yesterday, and that is a warning signal to consider seriously:

On the bull side NDX bottomed yesterday at one of my support trendlines and it might well hold there

I have mixed feelings about equities here and there is a real risk that we are seeing a double top on SPX if it can't break up from here soon. Copper has broken up very convincingly but if SPX just chops sideways until copper reaches the potential IHS neckline at 4.55 that would be a warning signal. As it is copper is still some way short of there, though it has broken 4.45 with confidence and looks likely to reach 4.55 next. I won't post the copper chart today as I already have seven other charts I'd like to post, and yesterday's chart still covers it well, but if HG/copper should retrace to 446, that should be a nice long entry level with a target at 4.55.

The US dollar had another bad night, and is now below 75.5. EURUSD has now reached the upper wedge trendline in the 1.44 area and we might see a reversal here:

The really interesting forex chart today though is AUDUSD, where AUD is hitting a four year rising wedge upper trendline intersecting with another 18 year support / resistance trendline. If we are going to see a reversal on AUDUSD anytime soon, this is the place. Here's the setup on the weekly chart:

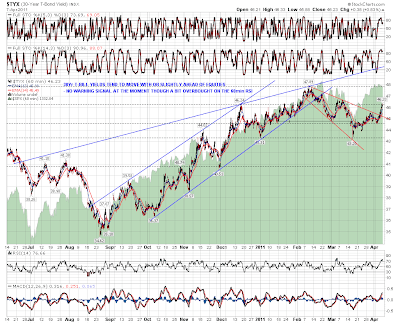
I was looking at 30yr treasury yields this morning for a directional clue on equities. That tends to trend up or down with equities, but sometimes weakens ahead of them. I'm not seeing any reason to think these are about to reverse seriously, though they're obviously overbought on the 60min RSI:
The last chart of the day is the very interesting chart for the Nikkei. I had a look at that yesterday after a talking head on Bloomberg suggested that Nikkei might be a long term buying opportunity. Looking at the chart, I'm inclined to agree, as the Nikkei has recovered and retested the broken rising channel lower trendline. As long as that trendline holds the Nikkei's looking pretty solid. :
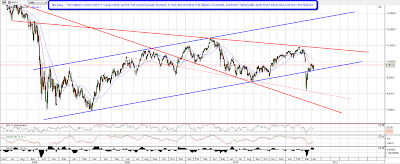
I don't expect a serious equities reversal here, and I'm not really expecting to see one. There are some worrying signs of weakness though, and until ES and NQ break up through 1338 and 2350 respectively, there's definitely some reason for short term caution on equities.

Market Neutral : Short TRGL, Long IMO

By -

Hey fellow Slopers,

Below is a market neutral trade I e-mailed to members of the market neutral trade notification list Wednesday night. I plan to place this trade Thursday. First, a quick, final reminder about the Short Screen message boards contest: today is the last day to enter to win an iPad 2 for posting a comment about a stock. Details here. On to today's market neutral set-up.

Toreador Resources Corp. (TRGL) is an oil & gas E&P based in France. I shorted TRGL as part of a market neutral trade (paired with a different long position) last July, when it was trading below $6 per share. I got stopped out for a loss a week later, when the stock was just above $7. As you can see from the chart below, TRGL went on quite a run from there, though it has since pulled back from its high earlier this year.

As of its closing price Wednesday, TRGL was trading at 12.29x its trailing twelve month sales.

Short Screen shows an Altman Z"-Score of 1.03 for TRGL (recall that Z"-Scores below 1.1 indicate financial distress, according to the model).

Audit Integrity rates TRGL as having "aggressive" Accounting & Governance Risk (AGR®), placing it in the 15th percentile (i.e., it has higher accounting & governance risk than 85% of the 8,000 companies Audit Integrity rates).

I plan on using a trailing stop here, in the event TRGL shares again buck the company's seemingly weak fundamentals and go on another run.

Imperial Oil, Ltd (IMO), an Exxon Mobil subsidiary in Canada, isn't a pure-play E&P: like its parent company, in addition to its exploration & production ("upstream") operations, it has downstream and chemical operations as well. Still, as with its parent, the bulk of IMO's earnings come from its upstream operations: 71% of IMO's earnings came from upstream operations in 2010.

As of its closing price Wednesday, IMO was trading at 1.8x its trailing twelve month sales.

Short Screen shows an Altman Z-Score of 5.24 for IMO (recall that Z-Scores of 3 and above indicate financial strength). A quick note about why Short Screen shows a Z-Score for IMO, and not a Z"-Score, as it does for TRGL: Short Screen uses Standard Industrial Classification (SIC) codes to class to categorize a company as manufacturing or non-manufacturing. Companies in SIC codes 2000-3990 are considered manufacturing companies. Although only a minority of IMO's earnings come from its refining business (part of its "downstream" operations), the company's SIC code is 2911 (Petroleum Refining).

Audit Integrity rates IMO as having "average" Accounting & Governance Risk (AGR®), placing it in the 40th percentile (i.e., it has higher accounting & governance risk than 60% of the 8,000 companies Audit Integrity rates).

I plan on using a trailing stop on IMO as well.

One Day Bear Market (by Springheel Jack)

By -

I posted the stats for the first trading days of every month in this bull market at the beginning of March, and I've done the same for the last trading days of every month on the same basis today. The contrast is stark. The SPX closed at 1328 yesterday, up 662 points since the intraday low of 666 in March 2009. Of those 662 points up, 184 were made on the first trading day of the month on a close to close basis, and if you'd sold at the open on a gap down, that would have increased to 234 points On that basis over 35% of all gains in this bull market could have been made on the first trading day of the month.

The last trading day of the month is statistically very weak in sharp contrast to the first trading day, and going long on a close to close basis would have lost you an accumulated 69 points since March 2009, which is to say that the last day of the month has been a brutal one day per month bear market within the overall bull market. That could have been improved somewhat by just going long at the open on a gap up from the previous close, but even in that case, you'd be up only three points over the period. Here's the table showing the stats:


In summary, the historical odds for an up day today are poor, and the odds for a long taken out at the close tonight, and held through tomorrow unless there is a gap down from the previous close, are extremely good. On that basis the important support levels on ES and NQ are covered in yesterday's post, and I'll just mention that I'm seeing rising channel resistance on ES in the 1337-39 area in case ES beats the odds today and rises anyway.

As that's cleared some space today, I'd like to have a good look at copper, which I'm concerned about because it is divergently bearish compared to equities. I posted the current range levels yesterday, thinking as I did so that the obvious next move was to support at 426.5, and it moved there shortly after I posted the chart. It's been trading around there since then and is showing some encouraging signs of making a low, though I'm concerned that it is still in an overall declining channel, and the strongest short term trendline is the declining support trendline from 440. That support trendline now has five hits and looks a very good counter-trend long entry if it hits again, within the larger downtrend:

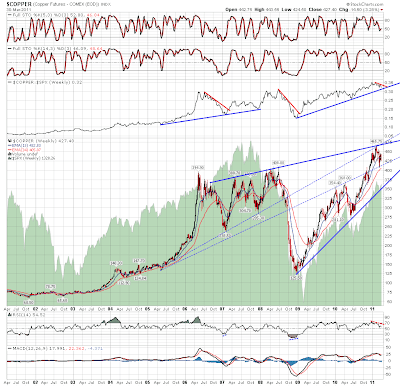
On the weekly chart the outlook also looks somewhat bearish, with a very strong resistance trendline that has now been hit six times in the last five years, though it has a history of multiple hits in short succession and we've only hit it once so far this time. I've added two internal trendlines to show that copper may have made a decent short term low, but if it gets back to 400 the obvious target is in the 360 area:

I've charted the second chart against SPX as there's a question in my mind as to whether equities might follow if copper breaks downwards. The evidence is ambiguous as though copper and SPX have tracked very well in the current bull market, the correlation was much weaker in the last one. Something to watch however.

The other instrument that I'd like to have a close look at is EURUSD, where a very important moment of truth is approaching. I mentioned this a few times but I'd like to underline quite how important this area is as it is the upper trendline of a huge falling wedge that would indicate to the 1.10 area if EURUSD fails to break up through it. The test will come in the 1.428 – 1.43 area, and the current rising wedge is not immediately encouraging for EURUSD. If EURUSD does top here, that doesn't have any immediate implications for equities as the last peak was in November 2009, some five months before equities topped in April 2010:

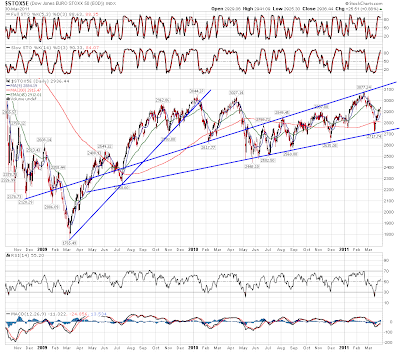
I don't know if anyone reading this trades the european stocks much, but I've seen something worth seeing if you do, and it is a simply beautiful broadening wedge on the Euro Stoxx 50. Nice clear upside target for this current wave up there:

I won't post the charts for main US indices today but the Russell 2000 made a new high yesterday, and we're close to new highs on most indices. The overall uptrend looks strong and I'm leaning strongly bullish on equities here. There are some concerns about the uptrend, but that's why they describe bull markets as climbing a wall of worry.  If ES obeys the statistics then we could see a test of 1315 today and that would be a very nice long entry in my view. Any move below 1310 would break the current rising channel lower trendline, and a break with confidence of 1300 would be a strong signal to exit longs until the situation clarified.

Challenging Declining Resistance (by Springheel Jack)

By -

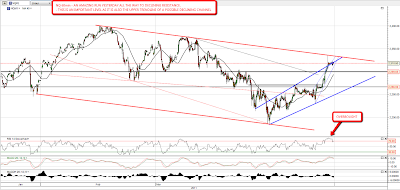
That was an amazing run yesterday, with NQ firmly back in the saddle leading equities up, which was bullish. SPX recaptured both the daily 20 and 50 SMAs, and NDX recaptured the 20 and stopped just under the 50. The main targets now are for NDX to move back above the 50, and a number of important declining resistance trendlines need to be broken. The first of those declining resistance trendlines is on the SPX daily chart, and if ES can hold the overnight gains then SPX will gap up over declining resistance this morning:

NQ spiked up to touch declining resistance from the high after hours yesterday, and breaking up through that is the next major target for NQ. That declining resistance trendline could be the upper trendline for a large declining channel, so that is an important level to recapture:

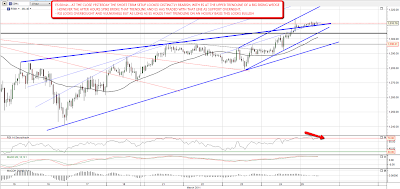
ES was at a bearish level at the close yesterday, as it stopped just below a candidate rising wedge upper trendline, and the short term setup was therefore looking distinctly bearish. The after hours spike up then took it through that trendline however and that broken trendline has acted as support for ES overnight. Both ES and NQ look overbought on the 60min, but as long as that support holds (currently at 1309.25), ES still looks bullish:

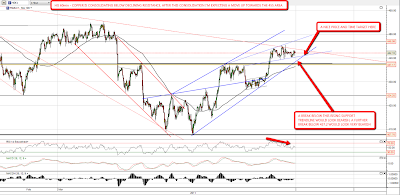
Copper is consolidating under declining resistance within a short term broadening ascending wedge. I'm leaning towards seeing that consolidate a bit longer, but an hourly close above 443.75 would signal that copper is breaking up. I have short term support at 440.50, rising support from the low at 438.75, and the IHS neckline at 437.75. A break of 437.75 with confidence would look very bearish but I'd be surprised to see that:

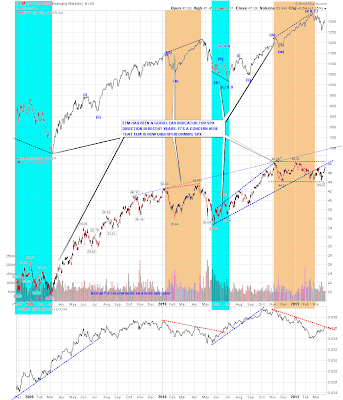
I post my EEM vs SPX chart regularly as an indicator and there are two important levels to watch there at the moment. The first level is the broken rising support trendline on EEM, which is close to a second retest. The second is the EEM:SPX relative trendline, where a break of declining resistance will signal that EEM has returned to outperforming SPX, which would look bullish:

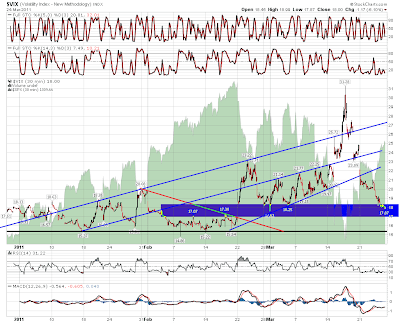
Vix has collapsed in recent days, and is now back in the gap zone. This is the third attempt to close the open gap since the correction began and I'm watching to see whether Vix can close the gap this time:

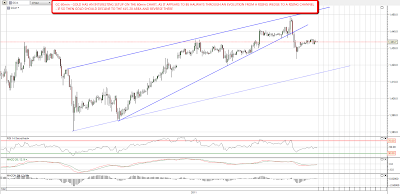
Lastly for today I had a close look at gold futures after it dipped sharply yesterday, and noticed an interesting setup on the 60min chart, as it appears to be partway through an evolution from a rising wedge to a rising channel where (unusually) the lower channel support trendline has already been established. if this continues then it should move down into the 1415 to 1420 area before reversing back up. That would be an interesting long entry level:

NQ and ES are both overbought on the hourly charts and I wouldn't be at all surprised to see some consolidation today. ES has decent support at 1304 and 1300, and NQ at 2300. I'll be looking for good long entries on any dip and would like to see SPX close the week above the daily 50 and 20 SMAs.