Slope of Hope Blog Posts

Slope initially began as a blog, so this is where most of the website’s content resides. Here we have tens of thousands of posts dating back over a decade. These are listed in reverse chronological order. Click on any category icon below to see posts tagged with that particular subject, or click on a word in the category cloud on the right side of the screen for more specific choices.

Egypt – Into the Looking Glass (by BKudla)

By -

For this post I will only focus on the food problem for Egypt, and why it is a window on the demons released by our insane monetary printing, and the unwillingness of command and control countries to de-link from a parity dollar policy.  The FED is pumping dollars to force China, et al to revalue, allowing for us to export,  raise tax funds, and velocity through inflation.  Unsustainable food and oil prices will force the hands of these governments to do just that, is the thinking.  The game of chicken is on, but an unintended domino in a volatile part of the world fell this week, and has the potential to engulf us all.

Look at the slides and narrative from http://209.157.64.200/focus/f-news/2665495/posts?page=3.  You can plug in nearly every North African/Middle Eastern country into this picture, but China, Russia, and India are also in the same boat.  Add to this tight supply and the real likelihood that Russia, Canada, and Australia produce less than normal, and we have some big problems coming.

"Egypt is reported to be the world’s largest importer of wheat. In 2010, the oil minister stated that Egypt imports 40% of its food, and 60% of its wheat. The problem this year is that world wheat production is down (at least in part due to weather problems in Russia) so world exports are down:
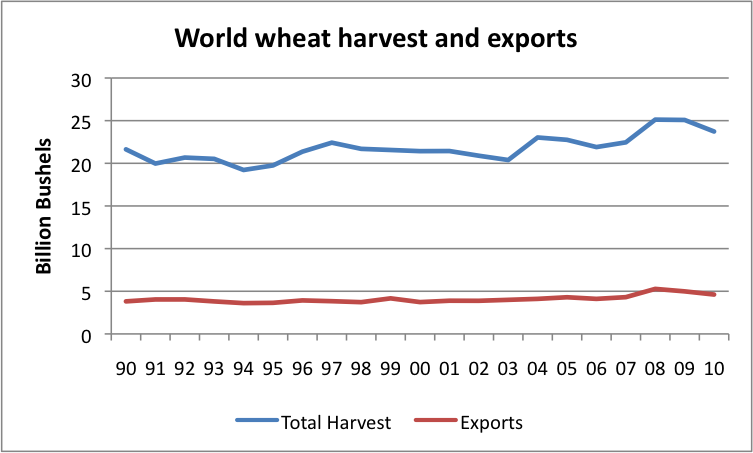
 

Figure 4. World wheat production and world wheat exports from USDA

A longer term problem, though, is that world wheat production has not been growing to keep up with growing world population. Part of this lack of growth may be competition from biofuels. Part of the lack of growth also relates to the fact that the “green revolution” improvements (adding irrigation and fertilizer) are mostly behind us. While irrigation and fertilizer greatly improved production at the time of the change, gains in production since 1990 have been much smaller.

The cost of imported food, particularly wheat, has risen, partly because of the relatively smaller harvest, and partly because the cost of production and transport is rising because of rising oil prices. Figure 5 shows the close relationship food prices and oil prices. The Food Price Index used in this graph is the FAO’s Food Price Indexrelated to food for export; Brent oil prices are spot prices from the EIA.
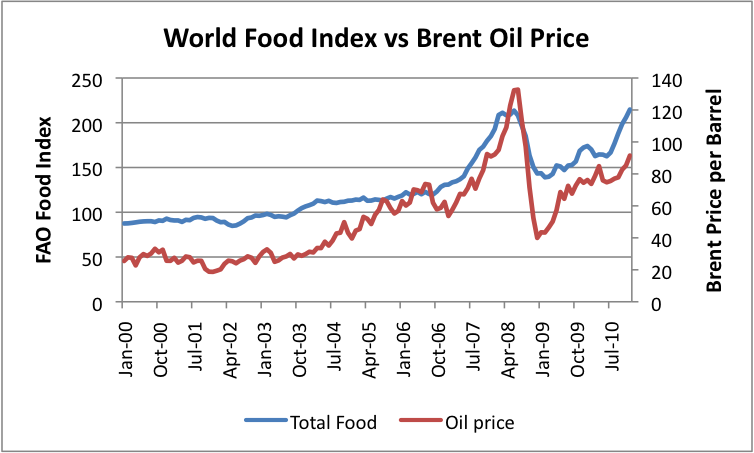
Figure 5. World food price trend is similar to Brent oil price trend.

With oil prices higher now (because world production is close to flat, and as countries come out of recession, they want more), food prices of all types are higher as well. Oil is used directly in the production of grain and indirectly in storage and transit, so its cost becomes important.

The higher food prices contribute to the overall inflation problem that Egypt already had. In 2010, the CIA Factbook estimated the inflation rate to be 12.8%. Since wages don’t always rise to match inflation rates, inflationary pressures have no doubt put more pressure on the government to increase subsidies, at a time it cannot really afford to do so.

Impact on the Rest of the World

Why does everyone else respond so strongly to Egypt’s problems?

One reason is that other Arab countries are also feeling some of the same pressures. Food prices are rising everywhere. Many low income people spend in excess of 50% of their income for food, so a rise in food costs becomes a real issue. People have come to depend on oil and food subsidies. If they are taken away, or not raised sufficiently to compensate for the higher costs of imports, it is a real problem.

Oil prices seem to be affected as well. If the Suez Canal should be closed because of disruptions, it could affect oil transit, particularly to Europe. According to the EIA:

An estimated 1.0 million bbl/d of crude oil and refined petroleum products flowed northbound through the Suez Canal to the Mediterranean Sea in 2009, while 0.8 million bbl/d travelled southbound into the Red Sea.

The amounts being transported through the Suez canal are now likely down a little from these amounts in 2011, because of reduced imports/exports worldwide, but they are still substantial. Europe’s oil imports are about 10 million barrels a day of oil, according to Energy Export Data Browser (using BP’s data). If all of the amounts that flowed northbound went to Europe, they would amount to about 10% of Europe’s imports, or about 7% of Europe’s consumption. In fact, some of these exports go farther–in particular to the US, or to Canada, so the amount in question is probably lower than this relative to Europe’s consumption, say 4% or 5%. But even a small shortfall is a problem, in a world that needs oil for transport, food production, heating, and many other uses.

The inability to send products southbound through the Suez Canal is likely to also be a problem. Part of what Europe does is refine oil, keep the products it needs, and send other products to customers elsewhere. The whole system is set up assuming close to “just-in-time” production and delivery. While there is some storage capability, after a few days or weeks the system is likely to start running into problems. Those in need of the refined products being sent southward through the Suez Canal will be facing a shortage, and Europe will have excess supply. Of course, it is possible to use longer shipping routes, but this uses more oil for shipping and takes longer, so is more expensive. There is also a time-delay when the new system is put in place.

All of these problems (relating to both north and south-bound oil traveling through the Suez) can be worked around, but there could be a period of disruption for a while, as supplies begin traveling a longer route."

If you have not already, I suggest buying MOO, RJA, JJG, and DBA on any weakness.  The revolutions may end, but not the food crisis.

Silver Bells (by BKudla)

By -

For the past month Silver has retraced some amazing gains, pretty aggressively, I may add.  But looking at the chart of the miners I selected below, it sure looks like consolidation to me, on the verge of a new upleg. 

Up until the unrest in Tunisia became a contagion in Egypt, I was in the camp of silver going to the $24-25 dollar range, and planned on holding any new purchases until the latter part of February to let that scenario play out.

In March, silver the open interest is growing incredibly, and in that OEX the buyers can demand the physical. Also, investors are emptying the Comex of inventory.  My view is speculators sensing a squeeze will start putting upward pressure on the metals after the February OEX closed.

Now back to North Africa, this is a game changer, people are being reacquanted with risk, and the Precious metals benefit from this.  Also, I cannot see a short term scenario that stops the FED from doubling our money supply again in the next twelve months, So I started buying back into my silver positions this week.

Below, I present three companies for you, AG is a core holding, and above $12.40 I will complete my buy program (gap fill and hold), EXK, I think has already broken out, and added to already.  Finally, HL, it looks like AG's chart (I do not own it).


Ag_2011-01-29_0553 
EXK_2011-01-29_0540 
Hl_2011-01-29_0548 

Copper Breaks Up (by Springheel Jack)

By -

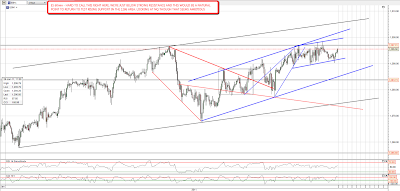
There's a bullish feel to everything this morning. Copper has broken the recent declining resistance trendline and may be forming a large IHS indicating to the 450 area. If it breaks through the neckline I have an immediate target just over 439 and a secondary target at declining resistance in the 444 area:

The big question today on equities of course is the GDP number and the reaction to it, and that's obviously hard to assess. Overnight action looks cautiously bullish on NQ however. The rectangle target at 2333 was made yesterday and NQ pulled back to support in the 2318 area overnight. That support held and if we see a strong move up on NQ from here, the remaining pattern target is on the (now huge) broadening top in the 2390-2400 area. NQ could make that target:

On ES there remains the possibility of a dip back to test support at 1286, and a break of that support would be bearish with the next immediate support at 1276. To reach it though would require a major technical breakdown, and I'll show why that is on the chart after this. ES is bumping around just under yesterday's resistance level but there's scope for a move today to the 1300 level and perhaps 1303 if we see a touch of the larger channel's upper trendline:

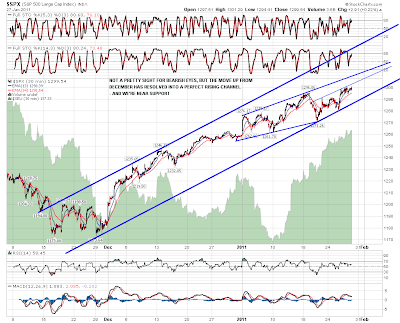
I was complaining in December that the rise on SPX from late November was shapeless and hard to pin down for targets. That's no longer the case, though the perfect rising channel that has formed on the SPX 30min chart will not be a welcome sight for bearish eyes. On the plus side we're not far above support and a break down through it would be very bearish. On the minus side the upside target looks to be in the (cough) 1350 area, though there are two decent resistance trendlines marked that should provide some resistance in the 1302 and 1310 area if hit today. The main rising wedge on the daily SPX chart has the upper trendline in the 1310 to 1315 area today:

The most interesting chart this morning is definitely GBPUSD, where a textbook bear setup may be about to fail dramatically. The chart is simply beautiful and my commiserations to any GBPUSD shorts if this setup fails, though the odds are still that it will play out as you would expect:

Hard to say what the GDP figures will bring, but I'd be wary of shorting the picture I'm seeing this morning. There are still some signs of a top forming here, but the old adage that you should never short unless you see significant weakness comes to mind strongly here. Good advice though I'd add to it that a major trendline hit can also be a very good short entry. Unless we rise a lot, we're not going to see one of those today.

Eye on Precious Metal Names (by Paulenoff)

By -

This is shaping up to be a very important and a very interesting day for the precious metals and the mining names. With oil inventories putting pressure on U.S. oil prices in general, it remains to be seen if oil's impact presses other commodity prices lower — in particular, the precious metals.

If the mining issues remain bid, and buoyant today, then we could come to the conclusion that they are following the equity market lead, rather than the weakness in commodities. Right now, my technical work argues in favor of price stability followed by potent recovery rallies in Barrick Gold (ABX) and Silver Wheaton (SLW).

As for the commodities themselves, looking at the daily charts in the precious metal's ETFs from last night's close, a sustained up-day today will indicate that at the very least the corrective leg from the January 3 high at $30.44 in the iShares Silver Trust (SLV) and from the December 7 high at $139.81 in the SPDR Gold Shares (GLD) is over, and that a recovery rally period already is in progress.  With that said, it is imperative that Tuesday's lows at $26.03 and $129.07 remain intact and viable.

IR7A5vgLg Originally published on MPTrader.com.

Anyone for Calamari? (by Springheel Jack)

By -

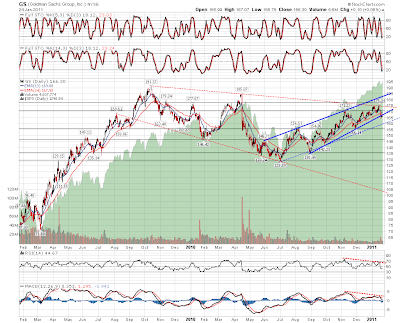
Lots of charts today as it has been very interesting overnight. First though I saw a lovely chart yesterday which I thought I'd share with everyone and it is the daily chart for everyone's favorite vampire squid Goldman Sachs.

It's a beauty, a failure at long term resistance, a broken rising wedge and negative divergence on RSI and MACD. Furthermore there's a broadening descending wedge in red dotted red line that suggests that the next serious downswing may see GS break 100. Strong resistance is slightly below $175 so the risk/reward on the trade looks pretty good, and they may in any case rise with the market over the rest of the week to a better entry level:

Everyone knew what was going to happen next at the close yesterday at the high, after the breaks of declining resistance on ES and NQ, but the very bullish short term scenario didn't deliver overnight and looks unlikely to deliver today. The rot set in first with copper, which broke the strong recent (wedge) support trendline and then gave up most of the gains in recent days overnight. A break of 422 should take copper to 415 if we see that:

I stayed up late waiting for the NQ rectangle to break up so I could enter long with a target at 2331, but it didn't break up, and after pulling back significantly overnight the next obvious target is the rectangle bottom at 2267. Rectangles are (69%) bullish patterns so that support should hold:

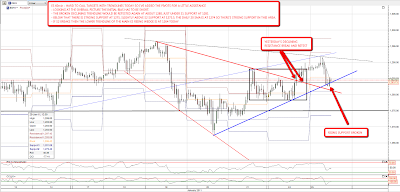
On ES rising support from the low was broken overnight and the next obvious target is the second retest of yesterday's broken declining trendline. If that breaks then there is strong support in the 1273.5-5 area, and below that there is the lower trendline of the main daily rising wedge at 1264:

Oil fell overnight to hit my target at the lower trendline of the five month rising channel. It's showing some signs that it may break through it, in which case I'd expect a move below 85:

What was really interesting overnight though was that EURUSD broke the support trendline from 1.30. This opens the way for a serious retracement which could give the short side a strong edge today. EURUSD has been the despair of the shorts in recent days though and could trade around the broken trendline for a while:

GBPUSD also broke rising support overnight and crashed over 200 pips on the news that the latest GDP figures show that the UK economy contracted 0.5% in the last quarter. I've no idea why this should cause such a fuss as this seems a natural transition from the jobless recovery in the developed world, to the jobless and growthless recovery in the developed world. The UK has moved earlier than most in trying to restrain wild government spending to s(t)imulate growth, and others will follow in due course IMO, but in the meantime GBPUSD is building a bear flag and I'm expecting more weakness:

This might yet turn around, but the immediate picture looks bearish, and I'm expecting to see weakness today. If that develops momentum there is a significant risk of a trend down day.