Slope of Hope Blog Posts

Slope initially began as a blog, so this is where most of the website’s content resides. Here we have tens of thousands of posts dating back over a decade. These are listed in reverse chronological order. Click on any category icon below to see posts tagged with that particular subject, or click on a word in the category cloud on the right side of the screen for more specific choices.

Undecided (by Springheel Jack)

By -

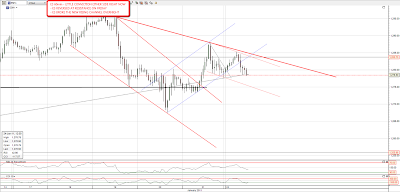
There are some days when the market direction stands out strongly, and others when it really doesn't. So far this is one of the latter kind, with equities dithering between support and resistance without any conviction so far. On ES declining resistance is at 1285-6, and a break up through there would look very bullish, and there are support levels just below at 1278, 1274 and the 20 day SMA at 1272. A break of 1272 would look very bearish and would suggest a hit of the daily rising wedge support at 1262 ES:

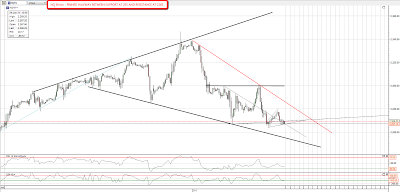
NQ looks equally uninspiring, seemingly pinned halfway between declining resistance at 2285 and broadening top support at 1255:

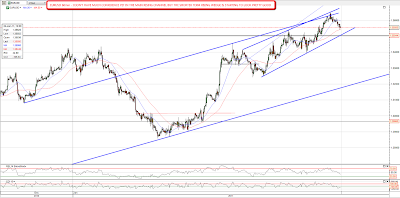
There's a mixed picture elsewhere. EURUSD is still looking stronger than I expected, but recent action has formed a promising rising wedge:

Oil looks bullish with a hit of strong support but will turn bearish on an hourly close below 88.3:

Silver looks bearish with a test of broken support overnight and failure there:

The real question today is whether we have topped or are topping? That could still go either way. A break of declining resistance on ES and NQ would open the way to a new high or double-top, and a break below support on NQ would be a very strong signal that we have already topped.

A Prediction Fulfilling (by BKudla)

By -

Last March I wrote my first post for Tim and discussed what can stop the Fed.  At the time we were going through our second bout of uninterrupteded ramping in the market, and I speculated on what will kill the economy.  Please read here for the post

http://dev.slopeofhope.com/2010/03/index.html

At the time the price of oil was $81, the price of gold $1130, and the interest rates were 3.7%.  In one short year, all of the levers that will kill the Fed's ability to strengthen the economy through more debt are now pushing hard against them, and are at breaking points for the economy. 


In addition, our inconvenience in these areas of price increases are turning into calamities overseas.  China and India are experiencing food inflation that, in my view cause world changing social unrest. South Korea is releasing emergency food stockpiles to ease pricing pressures, North Africa is experiencing regime change, and the other two BRIC countries, Brazil and Russia are suffering from these same hot money flows.  Oh, and don't forget Europe.  We are one bad harvest away from a worldwide upheaval (a post for another day)

All of this calamity because the TPTB are protecting the bank and other fixed income bondholders.  All of the extra money created worldwide is being used to buy hard assets (and being hoarded) with the fake money, and the money is being politically directed.  So in the end, the imbalances continue until the masses here in the U.S. can't absorb the costs anymore.  That time has come; as I always contend, the price of energy is the silver nail into the Fed.  Food and transport companies are getting crushed via margin pressure, and they will release that pressure onto us.  As that happens (already begun) the political heat ends the games and the long awaited debt destruction spiral can and will begin.

My bias is that we profit correct out of this quarter, the politicians panic regarding the Muni crisis, and we move into our last bout of the bubble, then it gets ugly.

Enjoy your weekend  :-), and go Steelers.

Major Commodities Top? (by Springheel Jack)

By -

I've been mentioning for a while that we're in an area where we could see a very major commodities top, and I'm aware that my view is at best a minority view, but I'd like to put the case anyway, and to stress that I'm seeing this from the perspective of an chartist who mainly calls reversals on the basis of trendlines, and to show how impressive some of the trendlines are that commodities have recently reached and, so far, reversed at. I can only show a few of the commodities here so I've chosen copper, silver, oil as three of the most influential individual commodities and CRB to represent the commodities complex as a whole.

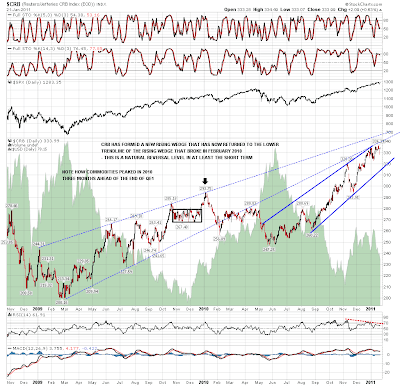
First the CRB, where the index has reached the lower trendline of the rising wedge that broke down in February 2010. It has also hit the upper trendline of the more recent rising wedge and is showing strong negative divergence on the daily RSI. At this level I would expect to see at least a retracement to the lower trendline of the rising wedge, and if that should break, considerably more. It's also worth noting that in 2010, CRB peaked almost four months ahead of equities:
The next three charts are much longer term charts. The first is the copper chart, where a major long term rising trendline has been reached. The trendline could be hit again short term, but unless we are to see a massive resistance break then that trendline represents the likely high for this move up, and I'd expect to see a move at least to the lower trendline of the shorter term rising channel soon:

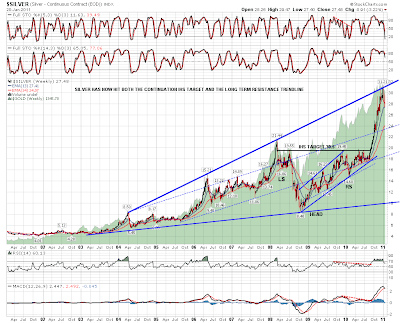
The resistance level reached on silver is even more impressive, and the shorter term charts are indicating a retracement back to the 25 level here, and if that level turns out to be an H&S neckline, which it might, then perhaps much further after a bounce there:
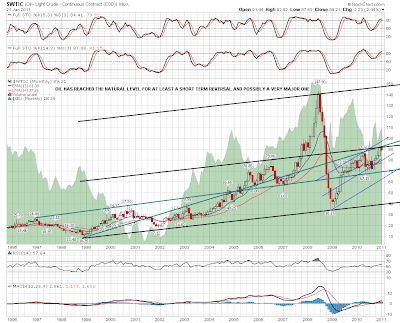
The trendline hit is less definitive on oil, but it has hit two significant looking trendlines in recent days, and we may well see a reversal on oil too. It might break up through back into bubble territory of course, but the low stocks and tight production capacity over demand that fed the 2007/8 spike simply isn't there any more, and on that basis, this is a natural reversal level for a substantial retracement:
Commodities are also a currency story as well of course, and on the commodity currencies we saw a major trendline support break on AUDUSD this week. At that break it has formed a very characteristic reversal H&S with negative divergence on RSI, and I'm looking for a retracement to test the important support level at 94 if this continues to play out. It would make sense if that took place within a sharp correction on commodities generally, as the prospects for USD aren't looking promising generally at the moment, in which case any such decline would be likely to be commodity related:

Quantitative easing has fed this boom in commodities, and commodities peaked months before the end of QE1 in late March 2010. QE2 isn't finishing until June 2010, but it may well be that commodities are peaking further before this time. On the longer term charts the real question is whether there will be a QE3, and that is open to doubt.

The Republicans won't be keen, and there would most likely in any case be a gap of several months between the end of QE2 and the announcement of QE3 during which, if 2010 is any guide, we would expect to see equities and commodities tank while bonds soar. If commodities have peaked now, that means that we could well see a ten or twelve month period now where commodities retrace some of their gains in the last two years. In the event that there is no QE3, it might last considerably longer.


Sky-High Copper

By -

I don't trade futures, but I thought I'd share a couple of copper charts just to drive home the notion (which apparently no one believes) that this market is overbought. There are two flavors of these charts – one of them adjusted (that is, the price is adjusted for gaps that take place during rollovers), and the other not. Here they are, in that order:

0118hgADJUSTED-


0118hgUNADJUSTED-

For whatever reason, copper has a very strong correlation to equity markets, and it's pretty evident that the huge run-up in prices over the past two years in awfully long in the tooth.

Pattern Festival (by Springheel Jack)

By -

I'm posting six charts again today, so I'll have broken my usual limit of five for the third consecutive day. However after what might be best described as a major channel and pattern drought in December, we now have decent tradeable short term patterns seemingly everywhere, and even with six charts daily I've been excluding a lot of the very interesting charts outside ES, NQ, oil, copper, EURUSD & GBPUSD. I'll try to post some of those in a holiday post on Monday.

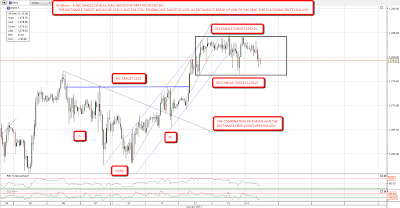
First ES today. I was leaning short near the close yesterday but the INTC earnings shortly afterwards changed the picture considerably. We now have a rectangle that has formed on ES with an upside target of 1292.5 and a 68% probability of breaking up. Together with the still unmet IHS target at 1292 on ES the picture is looking fairly bullish and I'm leaning long. Within the rectangle ES is a buy at 1276.5 and a sell at 1284, though for obvious reasons it is a safer long than short:

The picture on NQ is more complex. The rising wedge had broken down when the INTC earning's were released yesterday and then NQ broke back up into the wedge. Since then it has broken down again and we may see NQ retreat to strong trendline support currently slightly under 2290. I've marked in a shorter term megaphone that may well confine price moves today until it breaks up or down. An hourly close above the upper green trendline would be very bullish:

I posted some ambitious upside targets on EURUSD and GBPUSD yesterday morning and they both delivered the expected big rises to my target areas. The move on EURUSD particularly looks very impulsive and I am now working on the assumption that EURUSD has made a major interim low, though we'll have to see EURUSD break above 1.35 to confirm that. Short term I'm expecting some retracement that I'd expect to see bottom in the 1.31 to 1.33 area. An odd pattern has formed on EURUSD that I and others have seen before and could be an previously unidentified bottoming pattern. I'm provisionally christening this pattern the 'resting bat' reversal pattern as it looks somewhat like a bat's head with two long ears. Credit to my friend Bloodwine for coming up with the bat's head description:

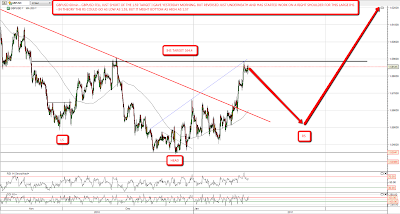
GBPUSD rose to just under 1.59 to the potential big IHS neckline and has since pulled back. This is an obvious area to see some retracement as well so I'm looking for some retracement into the 1.55 to 1.57 area to make the right shoulder and then, if USD has really made a major top, a move to the IHS target at 1.644:

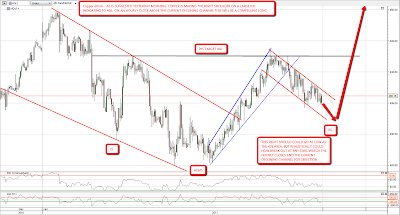
I posted a speculative IHS on copper yesterday morning and sketched out a potential path to make a right shoulder on that potential pattern. Since then copper has been forming that RS within a decent quality declining channel, and I'm looking for an hourly close above that channel to signal when the RS has bottomed. The IHS target is an ambitious 460 and that would be a very nice move to catch if this plays out:

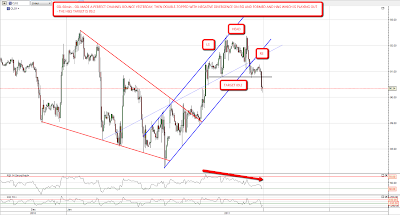
Oil made a perfect channel touch and bounce when and where I predicted yesterday, and bounced to make a double top with negative divergence on the hourly RSI. It then retreated to form an H&S pattern with a target at 89.2 and has broken downwards. I'm expecting that target to be made unless oil can break back above the pattern neckline at 90.8:

While I've been writing ES is showing signs that it may break down from the rectangle, which is unexpected, though these rectangles do break down 32% of the time. The downside target is 1268.25 though the probability of making the downward breakout target would only be 63%. I'd be inclined to watch the support levels on NQ for a decent level to buy the dip if we see an hourly close below the ES rectangle. I currently have NQ megaphone (declining) support at 2295.5 and (rising) trendline support at 2286.