Slope of Hope Blog Posts

Slope initially began as a blog, so this is where most of the website’s content resides. Here we have tens of thousands of posts dating back over a decade. These are listed in reverse chronological order. Click on any category icon below to see posts tagged with that particular subject, or click on a word in the category cloud on the right side of the screen for more specific choices.

Group Think (by Runedge)

By -

The problem with group think is that thinking is not allowed.  It should really be called group acceptance. The larger the group the harder the tendency for someone to disagree.  Right now the group is massive. The group think I am referring to is with the Fed, the Bernanke put and how the Fed will "just print more money and bail out the banks."

I have yet to read the Art Of War (have owned it for about 15 years now) but somewhere in there I am sure it talks about giving your enemy more credit and not simply labeling them as stupid or inferior.  The Fed is a smart group of people, albeit lacking in practical real world business sense.  The banks are benefitting for sure from playing the role of broker as the Fed expands its balance sheet.  How else can the Fed buy treasuries though?  We know they are monetizing the debt but at least by working through the primary dealers they can say they are not monetizing the debt.

There are three ways to grow nominal GDP

M (money supply)  x  V (velocity) = Q (output)  x  P (price inflation)

1 – Increase the money supply

2 – Increase the velocity of money

3 – Increase inflation

Let's use an example of a place called Fantasy Land (fitting for our current situation).

A farmer sells $50 in corn to a neighbor.  The farmer then spends $30 to get their tractor fixed from another neighbor and spends $20 on a bottle of moonshine at the local "packy." 

The GDP of this fine community is $100 assuming their is no inflation (hence the name Fantasy Land). Using the above formula we have:

Money Supply ($50) X Velocity (2, how many times the money was turned) = Inflation (0%) X Output ($100)

Getting back to Fantasy Land, excuse me the US economy, banks are not lending and people are not spending.  There is NO demand, so there is no velocity.  Money is not turning over.  Small business surveys continually state that their top concern is not lack of credit, but rather lack of customers.

So the Fed must grow the monetary base (even though Banana Ben has said they are not creating money). Look at the two charts below of money supply and velocity.  They have offset one another causing no real GDP growth, only nominal.


Screen shot 2011-01-09 at 3.14.24 PM


Screen shot 2011-01-13 at 7.58.05 PM


The Fed through QE is trying to make money so cheap it creates demand through inflation expectations (that car will be more expensive next month so I'll buy it today) and overall demand (I'll remodel that basement because Home Depot has zero interest rates for 18 months).  

Problem is it's not working.  Demand is not there.  The Fed is hoping QE will raise stock prices, which obviously has worked and give people a sense of wealth, a desire to spend.  It's also caused yield chasing and the use of massive leverage (leverage is now back to LEH levels which is truly astonishing).  

Commodities have been a great trade and people have piled in.  The result is rising input costs which cannot be passed along because there is no demand.  As input costs rise margins are compressed. Expect higher layoffs as firms do all they can to manage the bottom line.   Bernanke's efforts seems to be choking any demand left in the economy. 

Input costs have risen,  treasury yields have risen, gas at the pump has risen and now the USD has begun to catch a bid.  The market looks forward to QE3 but honestly Banana Ben may not have the opportunity to see that happen.  The debt ceiling will be reached in less than 8 weeks and in a recent survey 70% of Americans do not want it raised.  Sure Congress can do what they want, they have done so for years. But, the last election has taught many that if they want to keep their jobs they better listen.  The bond market may be telling them the credit card is stopped.  We see what's happening in the municipal bond market.  

A former Atlanta Fed President has publicly called out the Fed, their QE and their solvency.  Dallas Fed President Fischer has also publicly cast his no vote for further QE beyond June.

Just recently two regional Fed manufacturing surveys were revised downward.  QE is not working other than wealth effect which is not driving demand.  Bernanke is not a dumb man. He lacks business sense for sure but at some point the Bernanke put will expire.  To think the Fed will always be there is a clear sign group think is wrong again.

Submitted by Runedge.  If you would like to follow my blog please visit - Ultra Trading

Mixed Picture (by Springheel Jack)

By -

There's a mixed bag looking at my charts this morning. Copper and precious metals are looking weak, oil and forex strong, and equities could break either way. I'm looking for a move up to (finally) hit the ever-receding upper trendline of the rising wedge on the ES daily chart, and I might well get it if equities break up today. That target is now at 1293.5 ES. ES has formed what may be a bull flag since the high yesterday, but it is NQ that is looking really interesting this morning. On NQ a strong resistance trendline was broken a couple of days ago, and I've seen that referred to as a rising wedge, though if so, it isn't high quality. Since then however NQ has formed a smaller and much higher quality rising wedge, and it is that wedge that should define the direction of equities today. Rising wedges break up 30% of the time normally, but on the performance of these wedges within this strong uptrend of the last few months I'd put the probability of an upward break at more like 50%:

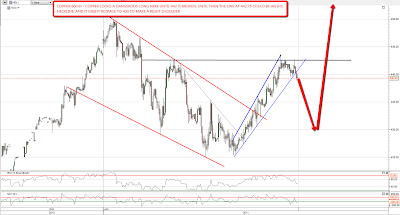
Silver is looking weak this morning and may be forming a large and rather ugly H&S. Copper failed at the neckline of a possible IHS yesterday and has given back most of yesterday's gains overnight. It was looking a bit stronger when I capped the chart below but I have marked in the possible retracement that we might see to make a right shoulder for the IHS:

Oil is looking very interesting today. as it is in a slightly messy but decent quality rising channel. There's a good chance of a double trendline support hit in the next two or three hours followed by a likely further move up. That would be an attractive long entry:

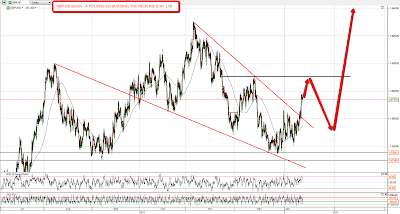
USD currency pairs are looking pretty strong overnight and I'm expecting some more dollar weakness. The GBPUSD rising wedge broke up yesterday and the obvious next target is the possible IHS neckline at 1.59. If  USD has topped, which is possible, I'd then expect to see a retracement to make the RS and then a move to a new high:

EURUSD is a tougher call here as the short term chart doesn't offer much in the way of usable trendlines. In the absence of those the next obvious serious resistance is just over 1.34. That's still 250 pips away at the time of writing, but it is the obvious target on this move up if equities break up too:

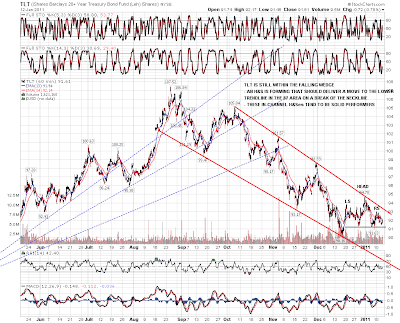
I was looking at the TLT chart this morning and the falling wedge that it has been moving down within since the announcements of QE2 last August. I have some serious doubts about whether it will make the next downside target as it would necessitate treasuries moving through a support level that would in all probability confirm the end of the 30 year old bull market in bonds. I'm expecting that confirmation in the next few months, but it is a big support level and I'd expect at least a pause there. Encouragingly I'm seeing an H&S form from the hit of the falling wedge upper trendline, and these in-pattern H&Ses are solid performers in my experience. If the neckline breaks with confidence I would therefore expect the next downside target in the 87 area to be hit:

Of all of these I'd pick NQ and oil as the most interesting plays today as both have clear support levels that should be hit early on and both have good odds of a strong rise after that support hits. In both cases a break of support would indicate more downside and they would become strong short candidates:

Moly Crunch (by BKudla)

By -

In five business days, the insiders for MolyCorp are allowed to sell their shares to the public, and having a company with no near term earnings prospects, a pricing model controlled by your competitors, selling for over 6 times book value, and a stock that is 300% of the IPO price, if you were an insider hedge fund, or executive, would you sell?

Now that the fever has broken on this stock, I am expecting at least a move back to the bottom of the channel.  I am short via Feb 55 puts, and I am also short REE Feb 16 puts.  I acquired and completed my purchases last week.  Why REE?  Well when folks start bailing out of MolyCorp, they are going to bail out of the ETF for Rare Earths, and REE will fall in simpatico.

Enjoy, and join me on the wild side  🙂

Moly_2011-01-11_1928 

www.arum-geld-gold.blogspot.com

Has EURUSD bottomed? (by Springheel Jack)

By -

I'm seeing bullish breaks everywhere this morning, and I'm going to break my usual limit of five charts and post a sixth today. I was expressing serious doubts about the very short term bear case yesterday morning and my doubts were well founded. On ES an IHS has formed and has started to play out. The target is 1290, which is also my target for upper trendline of the big rising wedge on the daily chart:

The falling wedge on copper that I posted yesterday morning has broken up, and has already progressed too far for it to become a declining channel. The target is the previous high just below 450:

I mentioned yesterday that the falling wedge on oil had already broken up, and it is now most of the way to the target which is also the previous high just over 92.50:

What's really alarming me this morning though is what I'm seeing on forex. I've posted the falling wedge on GBPUSD in recent days, and that too has broken up. The target is the previous high at 1.63, though if it is evolving into a declining channel the target would be 1.59:

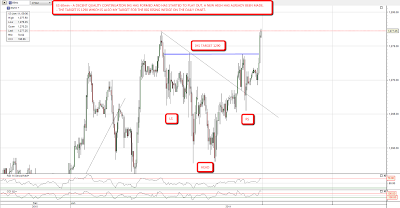
Many thanks to toad37 for pointing out the possible IHS forming on EURUSD yesterday morning. Since then a second alternative IHS has formed and both have broken up. The targets are 1.312 and 1.317 respectively and I've marked them both on the chart:

This is a bad place for a significant EURUSD low. I mentioned my analyst friend predicting an imminent major low for EURUSD in the 1.29 area the other day, and he could be right. Looking at the EURUSD daily chart I have a possible rising channel from the summer low, and very clear positive divergence on the daily RSI. If EURUSD has bottomed any looming equities correction is going to be fighting against a declining USD, which will be heavy going:

110112_EURUSD_Daily_Possible_Rising_Channel