Slope of Hope Blog Posts

Slope initially began as a blog, so this is where most of the website’s content resides. Here we have tens of thousands of posts dating back over a decade. These are listed in reverse chronological order. Click on any category icon below to see posts tagged with that particular subject, or click on a word in the category cloud on the right side of the screen for more specific choices.

Calling Reversals (by Springheel Jack)

By -

I've had a very hard time selecting charts to post this morning, as there are so many interesting charts that my initial selection for interesting candidates to post came to fourteen. I'll post an very unusually high number of seven charts this morning and put some of the others into a weekend post I'll post after the close tonight. My apologies to anyone who feels that seven charts in one post is too much to digest.

I wanted to say a few words on calling reversals this morning. Most traders call reversals regularly, and daytraders often call several on a single range trading day, but when an analyst calls a short term high nowadays, there tends to be a lot of dark muttering about calling the dangers of calling tops. There's an important distinction that needs to be made here, in that calling short term reversals is routine, and often highly profitable. It is calling major tops in a cyclical bull market that tends to end badly, though minor reversals sometimes have strong potential to turn into major reversals.

My point is that that I've called for significant short term reversals on SPX twice in the last three weeks. The first time was on Wednesday 19th January and we saw a decent retracement afterwards, and the second time was on Tuesday, and while we haven't seen a significant retracement yet, the market is currently lower than it was then, with no significant new high since, and every reason to think that it may go a bit lower before resuming an upward path. I've often called short term reversals in the past, and plan to do so often in the future. It's a fun game and, modesty apart, I'm often right. Anyone who wonders whether an analyst can really project reversals and targets with any accuracy should have a look at the ES chart I posted on 3rd August last year, in which I predicted the August reversal, and drew in the theoretical right shoulder of the potential IHS indicating to 1258 ES that we saw form and play out over the next six months. You can see that here. With the greatest respect to anyone who feels that buying the dip is the only strategy worth remembering, I'd point out that even to buy a dip, you have to select a likely entry, and in doing so, you are necessarily selecting a likely reversal area.

Does this minor reversal have the potential to turn into a major top? Absolutely, as any hit on the upper trendline of a big rising wedge has the potential to turn into a very major reversal, and I have several key charts that are flashing big red warning signs here, particularly on the EEM chart which has been a solid lead indicator chart over the last few years. It seems too long before the end of QE2 for a major high right here though, and I'd need to see some key support levels broken before I'd consider calling a significant top. I'd then need to see sustained weakness and some long term indicators turn red before I'd consider calling the end of the cyclical bull market. As some of these take six months or more to reverse, that won't be happening anytime soon. I'll post the EEM chart and some others that didn't make the cut today in a post this weekend.

There is one other chart to post today that is worth considering in terms of a short term reversal here. Blogger jonny O mentioned something yesterday that was worth charting up and showing everyone. I'd noticed it before, but had forgotten that it extended back below the 1000 level, and it is that from the 800s to the 1200s there has been a significant reversal every time that we have first hit the 20s level (plus or minus 10), into the 80s level (plus or minus 10). We saw that once each in the early 800s through to the 1200s with the last being the major interim top last April, and since then we've since it twice more in the 1100s, and once in the 1200s. That is a powerful repeating pattern, with the proviso that the short term reversal has gone considerably deeper than the target area with the first 1200s reversal and the last two 1100s reversals. I've marked this up on my main SPX chart for this cyclical bull market:

Short term, ES is still reversing gently after the support break earlier this week, and I'm expecting to see some more of that in the next couple of trading days unless we see ES make a new high:

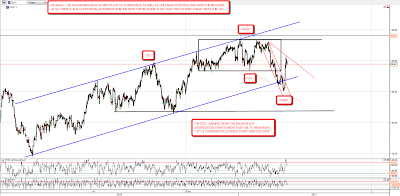
EURUSD didn't form the potential HS pattern I was wondering about yesterday, but is making good progress towards the wedge support trendline regardless. If that trendline is hit today it will be in the 1.347 area:

GBPUSD provides a good example of why I hate trading triangles today, as the triangle I posted on it yesterday had false breaks in both directions before resolving downwards. I'm expecting to see a hit on the triangle target at 1.585 and it might go lower:

Copper has now formed a slightly sloppy declining channel since the recent support trendline break, and it's possible, though I haven't marked it on the chart, that a continuation HS pattern is forming within that channel to take it into the 441 area:

I was speculating about a possible break of the silver rising channel yesterday, and after a bounce yesterday that has happened overnight. I'm expecting to see some more downside on silver from here:

The lower support trendline on the broken rising channel on oil is now holding nicely as resistance, and a short term descending triangle has formed with a target at 84.10. Descending triangles have a 64% chance of breaking downwards, but in the larger context, and Egypt permitting, I'd put the odds of a downward break here considerably higher than that:
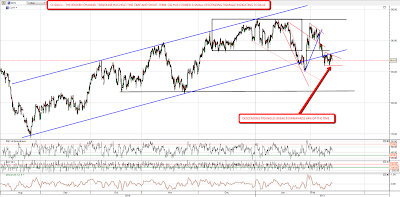
Of the short term charts that haven't made the cut today, AUDUSD has broken downwards as I predicted the other day and is now much of the way to my target in the 99.1-99.2 area and the ZB (30Yr Treasury) chart has now formed a full IHS indicating to the 119'25 area. I have a theoretical upper trendline for a short term declining channel slightly above there so I'll be interested to see whether that holds in the event the IHS breaks up. I'm still leaning sideways to down overall on equities today.
Sideways to Down (by Springheel Jack)

By -

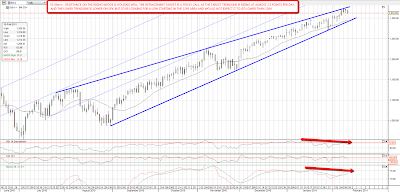
It's looking like we may not see the sharp retracement I was looking for here, as nothing has triggered a swift decline on ES yet. The target lower rising wedge trendline is move upwards at 2.5 points or so per day, so there's a chance that we'll just kick around in the 1300 – 1320 area until it is hit sometime next week. I've been considering retracement targets in the event that we can reach the trendline this week and I'd be ideally looking for a hit on the lower trendline of the wedge on ES in the 1295 area. The trendline looks lower on SPX though, so it might be that we'd go as low as 1284 support:

The retracement on EURUSD is proceeding well, and has formed a falling wedge, though it's early days and we need another hit on both trendlines to confirm the wedge. Short term EURUSD is forming an H&S that looks good to take EURUSD through support at 1.35. My retracement targets are the strong support levels below at either 1.34 or 1.326:

GBPUSD also looks weak here, and has formed a descending triangle, a pattern that breaks down 64% of the time, and the target is in the 1.585 area:

Flicking through the charts this morning long treasuries are looking due for a short term bounce here. They haven't reached the pattern target in the 115'24 area yet, so I'm expecting more downside when the bounce is finished:

Silver looks as though it may break down from the recent rising channel here, though we need an hourly close below the channel to confirm. Looking at RSI I'd expect a bounce after a break, perhaps to retest the broken trendline but possibly higher. If the channel breaks it will look an attractive short again. On the longer term picture I'm still expecting a deeper retracement than the one we have seen so far:

I've covered the short term bearish picture on copper very thoroughly this week, and it's still looking weak. I'll post an updated chart tomorrow when the shape of the decline has clarified somewhat. I'll do a chart on oil today as I've not covered the sharp decline this week. Oil was in a nice looking decline with the obvious target at 81.75 before Egypt blew up and now that Egypt is old news oil has resumed that downtrend. The broken rising channel has broken again and been retested. If we see a bounce at 81.75 then there's a possibility that we will be forming a large H&S with a target at 70:

I like using the hourly RSI as an indicator for significant highs and lows on many charts, and I've marked up some of the negative and positive divergences on some of the charts above. It doesn't catch them all, but it's always worth watching for these.

I'm expecting that we may well see an early bounce today and perhaps gap fill  but I'm leaning sideways to short until we see a lower trendline hit on the main ES/SPX rising wedge. USD looks short term bullish, copper, oil and possibly silver short term bearish.

Wedge Hits (by Springheel Jack)

By -

There's fair amount of art as well as science to drawing trendlines. Sometimes it's easy enough with a series of well lined up points, but sometimes, particularly with candlesticks, there are judgement calls that need to be made, and the trendlines are somewhat mushy as a result. I'd drawn the upper trendline of the SPX rising wedge a little lower as I thought the first high under 1300 might be a marginal hit, but the high yesterday was a perfect hit, so I've restored it to its original angle. As well as the wedge trendline hit SPX is also showing strong negative divergence on the daily chart, so I'm expecting a retracement today and tomorrow. I still have two alternative lower trendlines though and I'm expecting the next low to clarify the lower trendline too:

On ES the action for recent days has crystallised into a triangle, which overthrew slightly at the high yesterday and has not yet broken downwards. Triangle support is at 1312, and the target for the triangle is 1262, but we're not going to make that unless the wedge breaks down, which would surprise me. I'll be looking for the low in the 1274-1290 area with the probabilities weighted towards the higher end of that range, and there is strong support in the 1300 area that has to be broken first:

NQ looks less ambitious. The short term rising wedge broke down into a rising channel overnight, and as I suggested was probable on the chart, the channel has now in turn broken down. The wedge target is in the 2295 area and we have some decent support in the 2318 area to get through first:

I've been giving the copper chart a lot of thought. As I mentioned copper broke through my long term resistance trendline but it isn't quite as clear as that. Very long term resistance is definitely broken, and copper might well now go higher, but in the short term it has reversed at one longer term trendline and also at a previously unproved medium term rising channel upper trendline. There's also negative divergence on the weekly RSI and MACD, so the odds of a multi-week retracement look good here.

The copper weekly chart is arguing for a deep retracement here to somewhere between 355 and 380 depending on the time taken to retrace, and I don't know whether we'll see that, but on the hourly the short-term support trendline is broken and a small H&S has formed with a target at 443:

Overall the short side is looking very good today, with a dip more than likely coming our way. I'll be expecting to buy that dip, though I'll be watching in case the rising wedge breaks down. We're coming close in time and price however to my upside target near 1381 SPX in late March or early April, and I'm becoming doubtful that we'll see a deep retracement before then so unless we see that break I'll JBTFD.

Trading The End Of Day (EOD) Ramp by Market Sniper

By -

Here on The Slope, we are constantly railing about the phenomena known as the "the end of day (EOD) ramp." Yes, it seems to be manipulative. Yes, it appears to be contrived and yes, it is even deplorable. In price action, this is the proclivity of the stock market to go up (often large) starting at around 3:30 pm EST. Instead of complaining about it, make some money off it! THAT is our JOB as traders, after all.

Trading edges are found when patterns repeat. Since TARP, this has been almost a constant pattern. It was a minor pattern before TARP but it has become much more pronounced since TARP. Here is how I identify the trade, how I enter the trade and how I manage the trade. Since I am predominately an ES (emini S&P futures) day trader, I will use the ES here. You can possibly trade it with other instruments but back test this with your instrument of choice. This trade is to be done with a minimum of two contracts. If you are a one lot trader, do not trade this setup.

Identifying The Trade: Your window of opportunity is between 3:30 and 3:40 pm (EST). Price at entry must be at least 3 points (12 ticks) below the session high. By session high I mean the open out cry (pit session) high which starts at 9:30 am (EST) NOT the GLOBEX high (GLOBEX trading session starts the previous day at 4:30 pm (EST).

Trade Entry: Do not enter this trade prior to 3:30 pm or after 3:39 pm. You will attempt to identify the lowest price action within this time frame. I have notice over the past three months or so that the low is coming a bit later. Around 3:35 pm. Use whatever methodology your currently using to identify breakout price and break down price action, bottoming formations on your one minute chart, etc. to identify the low during this time window. You can scale into the position IF that is allowed by your trading plan and your trading with size (more than 2 contracts) if price moves against your entry. I would not suggest this. I do not do it but it is a viable entry plan.

Managing the Trade: Upon entry, place your stop loss at two full points (8 ticks=$100 per contract) beneath your entry price. Place a 1.25 point (5 ticks=$62.50 per contract) price target above entry for one half your position size. Then, kick back and relax. IF  your 1.25 target is hit, immediately move your stop up to your entry price. Do NOT forget that you have reduced your trade size by half. Reduce your contract size on the stop accordingly. Example: your trading 4 contracts. Your stop loss is for four contracts. If you have scaled out half (2 contracts). Your stop should now be only for two contracts. Now, as price moves in favor of the trade, do NOT start trailing a stop! You want to be in this trade through cash close which is at 4:00 pm! Still in the trade? Now the real fun begins. After cash close, you have two kinds of stops. A trailing stop and a mental time stop. At 4:05 pm, move your stop up to 1.25 points below price and trail it. Still in the trade at 4:13 pm? Exit the trade at the market. Do NOT stay in the trade during the last two minutes of the pit session which closes at 4:15 pm.

And there you have it. A complete setup and trading plan for the EOD ramp. You may find that this setup will often make your trading day. Last week, it was worth over 10 points ($500 per contract) to me. Even on Friday, when the ramp did not develop, I made money with it. Target price hit for 1.25 points on half, stopped out at entry on the other half of the position. Hope this helps.

Yours in the eternal quest of The Trading Edge-Market Sniper

A Promising Start (by Springheel Jack)

By -

Support finally broke on Friday and there were impressive falls on SPX and Nasdaq while oil spiked up on riots suggesting that the Egyptian dictator Mubarak may be replaced soon.Why's that important for oil? Because Egypt's Suez Canal is a potential choke point for shipping world oil supplies and because the toppling of Mubarak might lead to an aggressive islamist government in this key western ally in the Middle East.

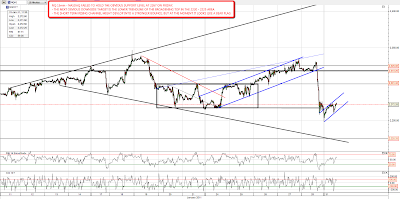
We'll see how that goes but rioting in Egypt looks set to run for a second week this week and Middle Eastern stockmarkets, which are open on Sundays, were down a further 3% to 5% yesterday. Things look promising for more downside on equities in the west too as ES failed to hold the support levels at 1276 and 1273 on Friday and traded as low as 1262.5 overnight. The next target support level that I have on ES is the potential H&S neckline at 1258 and I'm expecting that we'll see that hit this week, though we might well see a bounce first. That matches exactly with the lower trendline of the rising wedge on the SPX daily chart:

NQ failed to hold the key 2267 level on Friday, and is now rising in a short-term channel that looks like a bear flag. If it breaks downward the obvious target is the lower trendline of the broadening top in the 2220-5 area:

Encouragingly for equity shorts, the technical picure on EURUSD now also looks increasingly bearish with a significant break downwards on Friday. For two weeks now EURUSD has been breaking through a succession of three progressiverly shallower trendlines and is now bouncing from a potential H&S neckline. If that plays out the pattern target is at 1.338:

Copper was looking divergently bullish on Friday morning, made my 439 target, reversed to channel support at 433.6, and is now moving up towards declining support in the 444.5 area. I'm expecting that target to be made, and (slightly less confidently) am expecting a reversal there towards the larger channel support in the 425 area. A break above 444.5 would look very bullish and the next short term top will be signalled by the break of the short term channel:

Silver is continuing to look extremely bearish, and reversed at the top of the current declining channel yesterday. I'm expecting a move down within that channel to the key support level and potential H&S neckline at 25. It is possible that silver's H&S has already formed higher with a target at 22, and if 25 fails to hold, that is where I would expect silver to go. A break up through the declining channel would look very bullish and would put the immediate short scenario into serious question:

Oil is the star of the current geopolitical show at the moment of course, and has broken up convincingly from the declining channel that had seemed likely to take it to the potential H&S neckline at 82. Added to that potential H&S pattern we now have a potential (continuation) IHS forming with the neckline at 93.5 and the target in the 102 area. If the crisis in Egypt deepens this week, that will be one to watch:

We may be watching a very significant reversal forming here, and if the SPX rising wedge breaks downwards then I'll be looking for a retracement into the 1200 SPX area, which I'd expect to hold unless Atilla at Xtrends is right about equities having already made a very major top.