Slope of Hope Blog Posts

Slope initially began as a blog, so this is where most of the website’s content resides. Here we have tens of thousands of posts dating back over a decade. These are listed in reverse chronological order. Click on any category icon below to see posts tagged with that particular subject, or click on a word in the category cloud on the right side of the screen for more specific choices.

Oil’s Explosive Move – Chart by Mike Paulenoff

By -

Crude oil's upside pivot reversal off of last week's low at $83.85 has morphed into a powerful spike that has climbed above the prior high of $92.84 to a new, post-Dec 2008 high at $99.94 today.

The explosive upmove has blown through key resistance at $90.15 — the 50% resistance plateau of the huge $114.87/bbl bear market from July 2007 to Dec 2008. It has hurdled key multi-week resistance at $92.30/90 into what looks like a vicious new upleg that could be heading for a confrontation with the upper channel resistance line, now up near $110.50 to $113.00.

At this juncture, only a major downside reversal that breaks and sustains beneath $92.00 will begin to compromise the developing vertical surge in oil prices.

KlO22uWiF
Originally published on MPTrader.com.

Surfin’ USA (by Springheel Jack)

By -

Trading is like surfing in a way. You wait for a promising wave, you pick your entry carefully, and then you ride it as far as you can. It's a process that requires self-discipline, patience and skill, and inexperienced surfers and traders tend to make a lot of mistakes. I was saying to someone yesterday that the bear setups that I write about when they appear are inherently riskier plays in this cyclical bull market, and that they need to be played cautiously and with an awareness of the shorter and longer term pictures. When they play out though they can be very profitable and set up great buying opportunities at the end of the move.

I've been getting some suggestions this week that I shouldn't write about bear setups as they form, because they distract less experienced traders from the longer term long opportunities in this POMO-driven bull market. Perhaps, but I chart what I see, and it would be dishonest to just paint a bullish picture & chant JBTFD every day as though that was genuine technical analysis rather than just a currently safe medium term mantra for trading rookies. I'll chart and blog what I see, and readers can take it or leave it as they wish.

I'll be posting an unusual seven charts today as there are a lot of very nice looking setups this morning. The first chart is NQ, where the strong resistance trendline was broken yesterday morning before a bounce back into the wedge to test 2400 resistance. NQ is trading under the broken trendline now and I'm hoping to see 2400 tested under the broken trendline today as that would likely offer a very nice short entry:

On ES the picture is subtly but importantly different. The support trendline was also broken there yesterday but after the break back up is still acting as support. I'm not expecting that to last long , but we might well see another move up within the shorter term rising wedge I've marked up on the chart:
There's a mixed picture on other instruments / indicators today. Copper is trending and reversing beautifully at the moment and is offering some really nice short term opportunities. It reversed up yesterday and then down overnight. I'm expecting a main channel support test in the 441 area soon, very possibly today and while I'm expecting a bounce there initially, copper may well break down through it afterwards, opening up a lot more downside:

Silver made new highs yesterday and looks like an interesting, if suicidally brave, short opportunity this morning. I'll cover that another day as I'd like to add the longer term picture in there too, where longer term resistance now looks fatally damaged. Short term it has reached a potential resistance trendline though, and gold's failure to make a new high with silver is a possibly important bearish divergence. On the other important indicators today I've been watching EURUSD very carefully to see whether it has bottomed, and posted the falling wedge upper trendline yesterday as my bull/bear line in the sand. That line was an unconfirmed two hit trendline yesterday and the bounce was slightly higher at an alternate, now confirmed, trendline. While that trendline remains unbroken EURUSD is still in bear mode, and I've given the next downside targets on the chart:

AUDUSD had a similar moment of truth yesterday and reversed at resistance. That line remains the bull/bear dividing line and I'm expecting a significant drop unless it reverses to break that trendline:

I haven't charted the Yen much in recent months, but I was asked to look at this the other day and charted it on various timeframes. I was strongly struck by how well the 60min RSI signals important reversals, so I'll be looking at this a lot more often in future. I was also struck by the simply amazing long term short setup on Yen, which looks likely to drop a third in the next few years, and a lot of people have been talking about this and shorting the Yen. It's great to see such an opportunity on an instrument where the fundamentals really stink, but I haven't shorted it yet, and that's because the short term setup looks bullish rather than bearish, so I'm expecting a better entry soon. I'll cover the longer term setup another day but here's the short term USDJPY chart, which I would stress is an INVERTED Yen chart, so the bearish look of the chart is actually a short term bullish chart for Yen:

The last chart of the morning on 30yr Treasury futures, and I have to say that the bearish setup here is at odds with the bearish setup on equities. Treasuries have been in a counter-trend bounce for the last few days, but there's a nice looking bearish wedge on the chart that suggests strongly that they will soon resume the long march downwards. Obviously that could happen after an equities correction here:

Overall I'm still leaning short today, though NQ particularly might see a bounce to test strong resistance at 2400 again. Obviously it's opex Friday today and there could be some strange moves as a result. Big downward moves are fairly rare on opex Fridays and I'd be surprised to see one of those today.


Wedges Everywhere (by Springheel Jack)

By -

I know I've been sounding like a broken record lately, but while the market continues to make new highs, the underlying technical picture continues to deteriorate, and I'm still of the view that we're going to see at least a sharp correction soon. Obviously POMO is still force-feeding the market with billions of dollars every day, but that was the case last January as well, and didn't stop SPX from correcting 10% from the high then. I'm doubtful about seeing a major top before QE2 finishes in June, but that's only four months ago now, and on any measure equities are looking rather overbought at the moment, and the pattern setups suggest that the risks are weighted heavily to the downside here.

On the ES daily chart the rising wedge from the July low is still looking pretty good, and I'm expecting at least a return to the lower trendline soon:

Shorter term on the hourly chart there is now another rising wedge on ES with the support trendline in the 1225.75 area at the moment:

On the NQ hourly chart there is yet another rising wedge with a lovely support trendline with five perfect touches so far. I'm expecting some decent downside action as and when it breaks and support is now in the 2380 area:

Elsewhere EURUSD is looking weak and I'm expecting to see more downside today with at least a test of the recent low coming up. I'll post an update on that tomorrow as I want to cover silver, copper and oil today. Silver looks weak with a possible double top on declining RSI. It has tried twice and failed to recapture the lower trendline of the broken rising channel. An H&S pattern may be forming:

Copper also looks weak here with another possible double-top on declining RSI. Another H&S pattern may well be forming:

Oil made a succession of marginally higher highs on declining RSI, and is now correcting. Another H&S pattern may well be forming:

Obviously there is a heavily bearish theme to what I'm seeing, but it is what it is. In my first post of December I was calling for a wave up, and I'm now expecting a wave down. Nothing goes up in a straight line, not even this, the strongest cyclical bull market in history by a wide margin. I'm expecting that we might see a bit more upside today but IMHO at least, when those support trendlines on the ES and NQ hourly charts break down, we'll be moving onto selling the rips for a while.

Gold & Silver Chart Analysis (by Mike Paulenoff)

By -

A mixed bag in the metals sector today, which bears close watching for the iShares Silver Trust (SLV), Silver Wheaton (SLW), the SPDR Gold Shares (GLD), and Freeport-McMoRan Copper & Gold (FCX).

The SLV is pushing up towards a challenge of its Jan high at $30.44, although for the first time since the pivot low on Jan 25, the SLV is not leading the charge today. Instead, SLW is out front. The change in profile is bothersome to me, as the SLV needs to retake the leadership role.

While this bears watching, let's also notice that SLW has hurdled its Dec-Feb resistance line (36.25/30 area), which could represent a potentially potent upside breakout if the stock can close above 36.30.

The GLD gapped, up too, but is not as strong as the SLV, and has the look of near-term exhaustion ahead of a pullback. FCX smacked into its Jan-Feb resistance line at 56.50, and has since reversed to the downside in what looks like the end of an initial upmove off of its Jan-Feb lows at 52.30/76.

What is bothersome about FCX is what appears to be a significant downside reversal in copper prices today from multi-year highs, despite the strength in gold and silver. Increasingly, the fortunes of FCX appears to be attached to copper rather than gold, which must be watched closely in the days ahead.

WWe4NBhgj
Originally published on MPTrader.com.

Trendline Breaks (by Springheel Jack)

By -

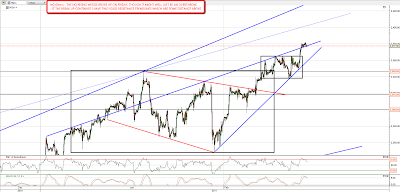
Friday's action was a lot more bullish than I expected, and of the main resistance trendlines on equities, only the upper trendline of the main ES daily rising wedge survived the day. Worryingly though, the equivalent on SPX looks as though it may well break, and it could be that the trendline on ES might fail too. That would be a great shame, as if it survives it will be a superb tool to navigate the remainder of the current move up. If it breaks my upside targets will also rise considerably, as the old upper trendline for the wave up to April 2010 would then become the obvious upside target. That's slightly over 1400 at the moment and I've marked that on this chart:

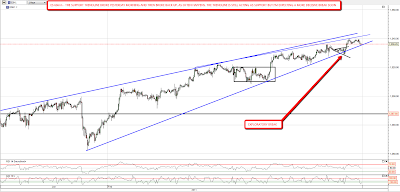
On NQ the upper trendline of the rising wedge that I posted on Friday broke up. That could just be an overthrow before the decline, but equally it might not be. If the break up is sustained I have two other decent resistance trendlines that would be the obvious next targets, and they're some distance above:

I had a close-up look at the broadening top on IWM to see where the upper trendline is exactly, and that broke up on Friday. There's a small rising wedge within the pattern that may restrain any rise in the short term, but I don't think broadening tops overthrow much as a rule, and on an upward break they make target 62% of the time, so that looks bullish:

So what the other signals for direction today? Mondays are generally bullish of course, and copper, where breaks often precede significant moves on equities in the same direction, has broken up from the declining channel I posted on Friday. I was concerned when copper reversed short of the declining channel lower trendline on Friday morning and there has now been a very definite break up overnight. Copper is now close to making a new high, and that definitely looks bullish for equities though it might yet be a double-top:

EURUSD is still firmly in retracement mode, though that hasn't restrained equities in recent days. EURUSD broke down through 1.35 support overnight and hit my target support trendline in the 1.355 area. Since I capped this chart though, EURUSD has broken down through that trendline on an hourly close, and there's some support at 1.34 and 1.325, but the broken trendline is also the sloping neckline on a large HS pattern indicating to 1.3115. This break down is obviously very bearish for EURUSD and that may have bearish implications for equities, though the fall last week didn't restrain equities much of course:

I posted a chart a week ago showing the Transports index having broken down from support but also showing a falling wedge that might return the index to the previous high. That falling wedge broke up in the middle of last week and the Transports are on the verge of making that new high. If they do so then that will be a Dow Theory confirmation of the new highs on Dow, and that would definitely be bullish:

Overall the picture looks mixed this morning, and I'm leaning bearish on balance until we see Transports make a new high, ES break the wedge resistance trendline, and copper make a new high with conviction. A serious break down in EURUSD is the main hope for the short side this morning. The breaks up on NQ and IWM look guardedly bullish however, and it wouldn't take a huge move up today to make the overall picture look very bullish indeed. We shall see.