Slope of Hope Blog Posts

Slope initially began as a blog, so this is where most of the website’s content resides. Here we have tens of thousands of posts dating back over a decade. These are listed in reverse chronological order. Click on any category icon below to see posts tagged with that particular subject, or click on a word in the category cloud on the right side of the screen for more specific choices.

Looking Interesting (by Springheel Jack)

By -

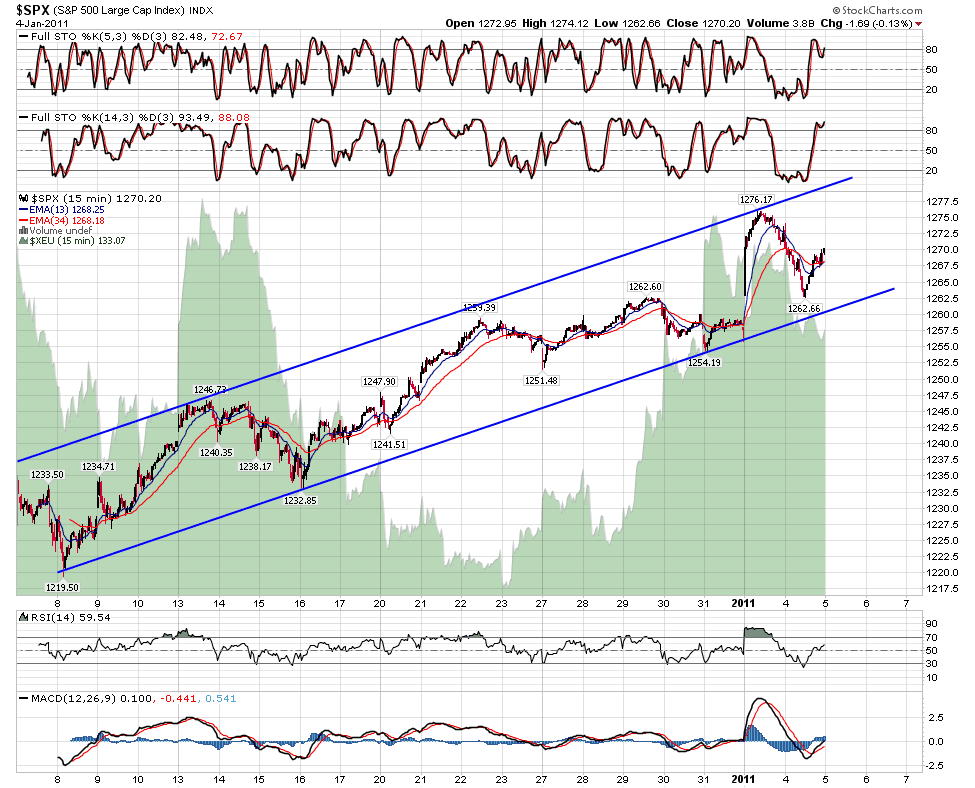
I've been away for a few days and on my return things are starting to look a bit more interesting on the bear side. I'm not really expecting to see a significant top before February, but there are some serious signs of weakness appearing now and we could top earlier. The key thing on SPX short term is to see whether the rising channel for the last month can be broken. That's best seen on the SPX 15min chart and I'm expecting to see at least a hit of the lower channel trendline today:
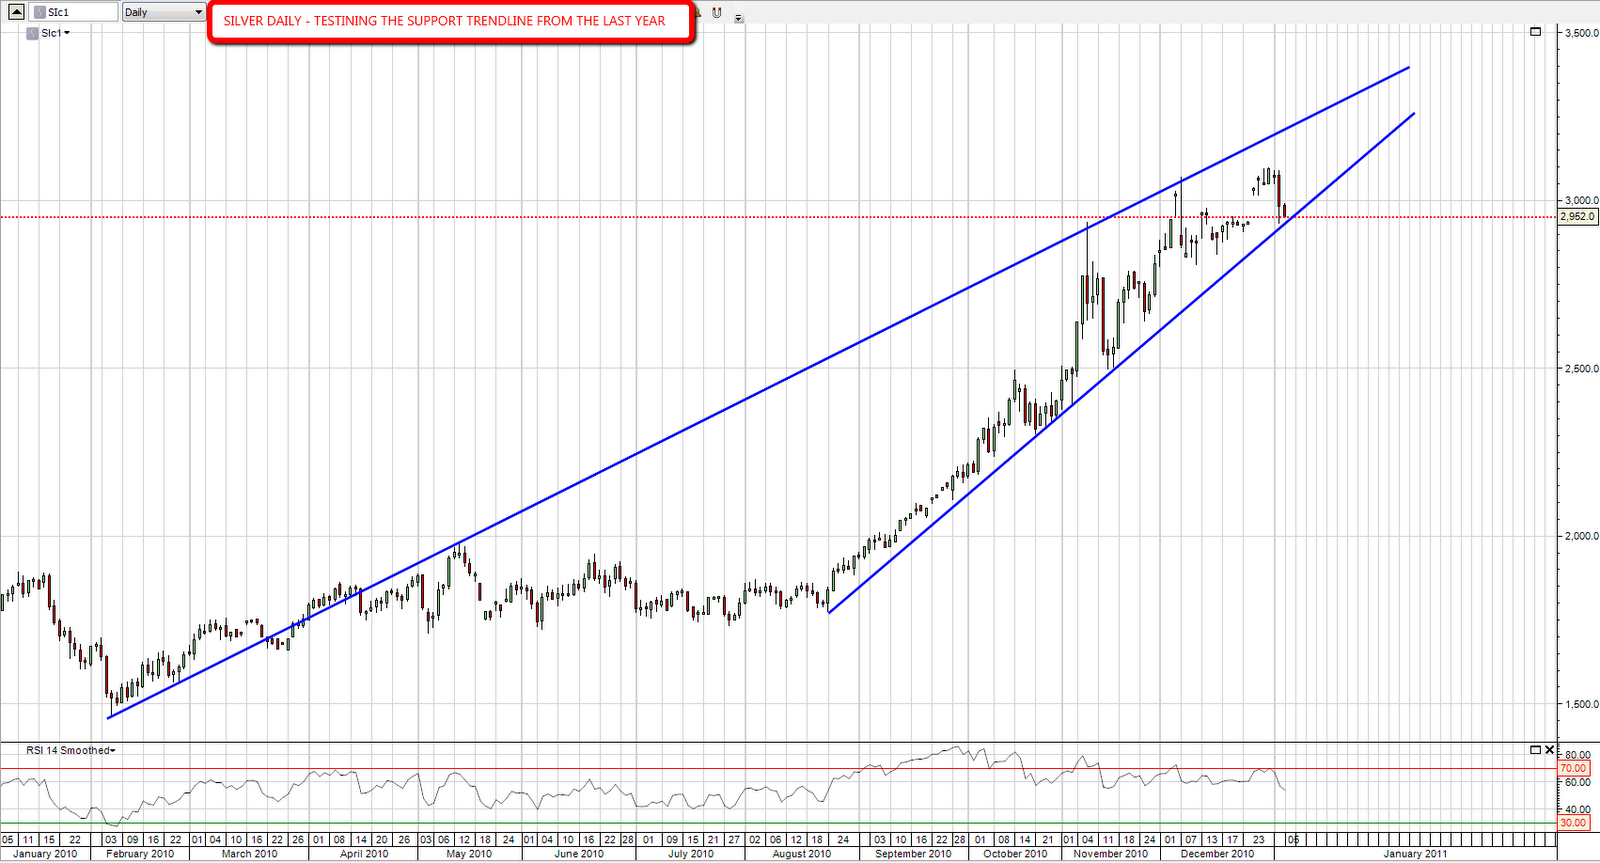
The spike in silver last week left me feeling bullish on equities short term then so it's very interesting to see that silver is now showing real signs of weakness.  Silver tested the support trendline from $18 yesterday and I think that there is a very real chance that it will break. Silver has hit the obvious long term resistance trendline now and a break of shorter term support here should signal a serious correction. Here's the one year view:
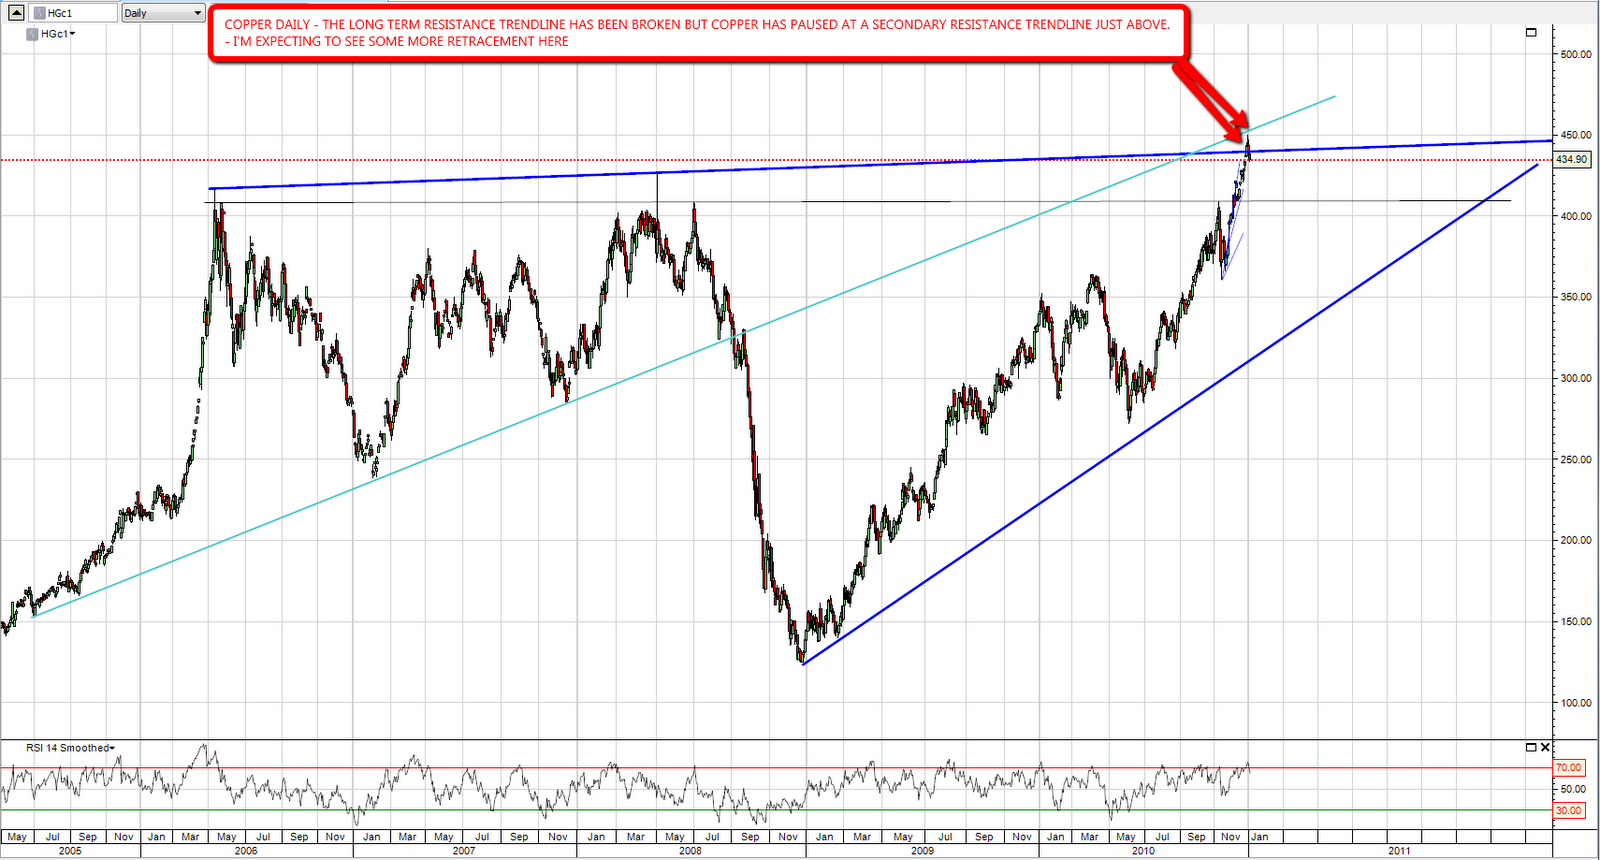
I was very disappointed to see copper break up through long term resistance last week but shorter term resistance slightly above has held and copper may well also have made a significant interim top:
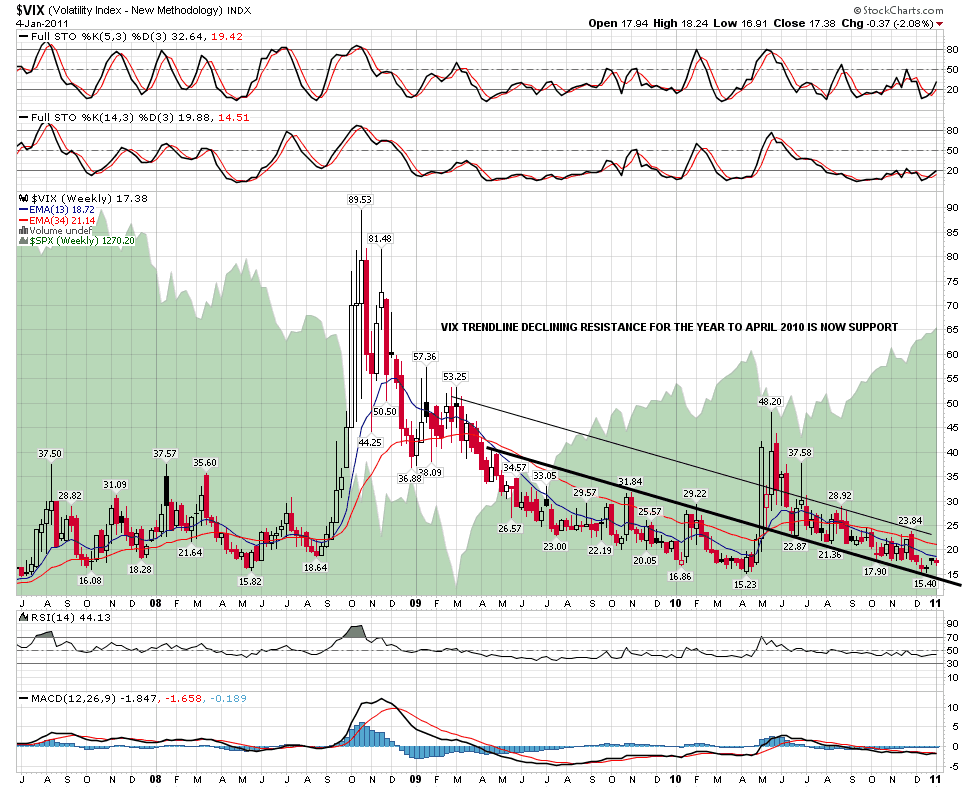
I posted the Vix weekly chart a couple of times in December to show the key support trendline being hit. Vix has bounced a bit since then and I'm not expecting to see that support trendline broken anytime soon:
I also posted the TLT falling wedge in December. As I expected, the upper trendline of the wedge was hit and we've seen a nice reversal from there. I'm in two minds about where TLT goes from here though. A move to the lower trendline of the wedge would require a major break of long term resistance on bond yields, which would in my view confirm that the thirty year bull market in bonds has finished. I'd like to see that but it may well be that the TLT falling wedge will break instead, which would then be a decent long entry if that happens:

I'm expecting to see a topping process start in earnest soon and it looks as though it may well have started already. I'm leaning short today and I think we could see significant further weakness this week. Regardless I'm not now expecting to see a lot more upside on equities before the next major interim top is made.
Triple Peak Pressuring GLD (by TheTechTrader)

By -

The big picture that is evolving in the SPDR Gold Shares (NYSE: GLD) shows that yesterday's high at 139.00 represented the third failed attempt to hurdle and sustain above 139.00 during the past eight weeks. Today's sharp gap-down open and downside follow-through (so far) leaves behind a triple peak that is putting increasing pressure on the Nov-Jan support line, which cuts across the price axis today at 134.75.

Let's notice that the rising 50-day moving average also is in the vicinity of the near-term support line, at 134.58, which adds more significance to a violation of the 134.75/50 support area.

If 134.75/50 is violated and sustained, given the pressure exerted by the triple peak, it could trigger an avalanche of selling pressure that drives the GLD towards 130.00-129.80 quickly.

4uI0eNE2j
Originally published on MPTrader.com.

Upside Risks (by Springheel Jack)

By -

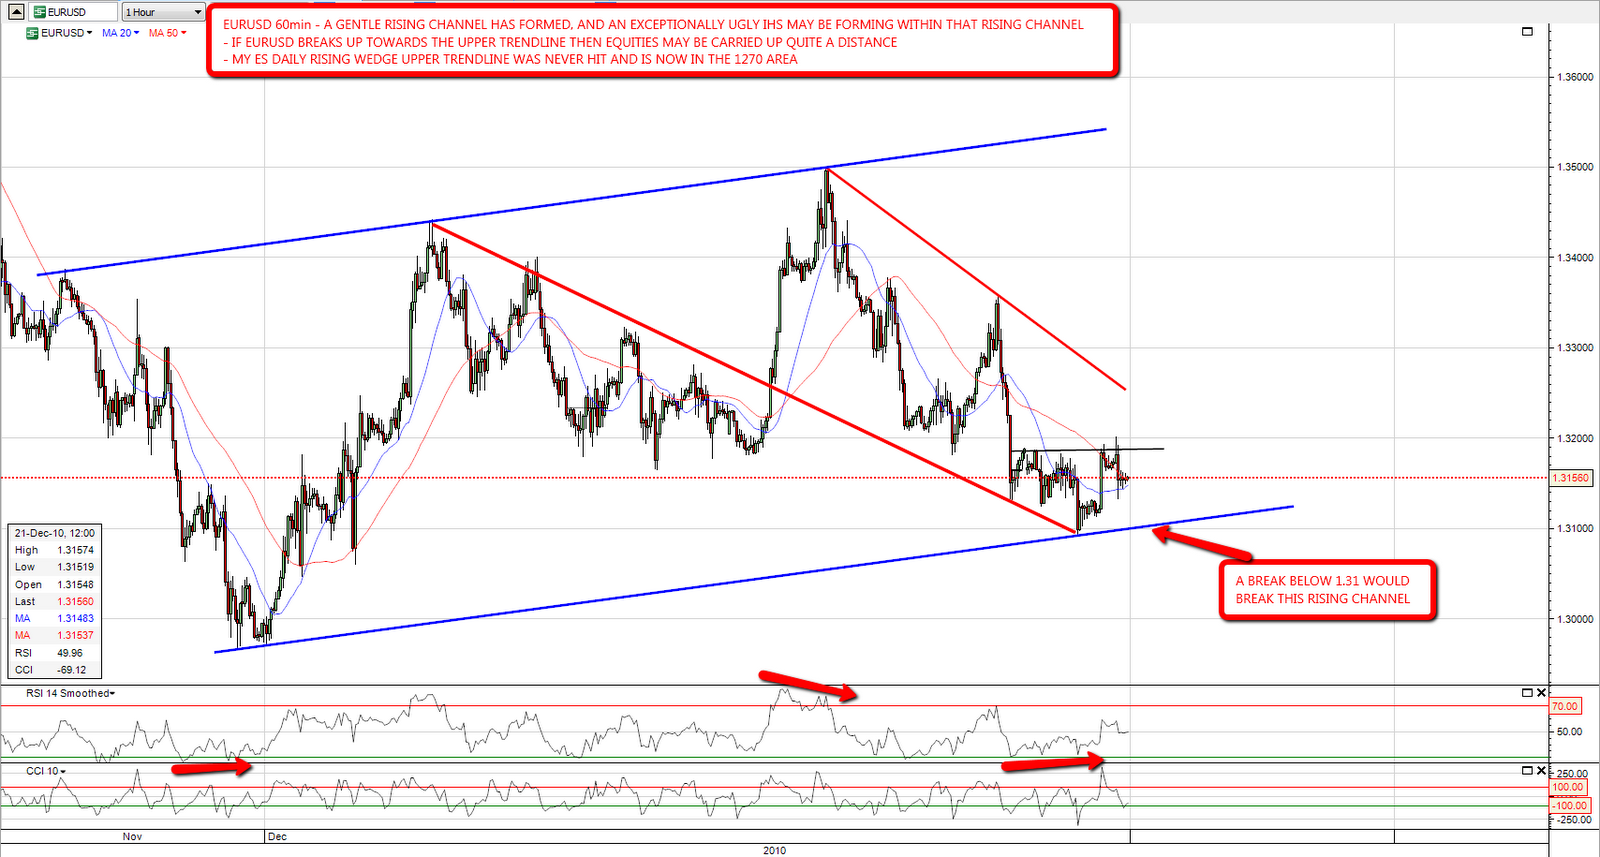
I saw an alarming rising channel on EURUSD last night, and I'm watching that very carefully this morning. An IHS of surpassing ugliness may be forming within it:

Equities have been trading sideways to up for the last few days, while EURUSD has been moving down. If EURUSD reverses decisively and rises 400 odd pips from here to the top of the channel then we might well see that end, and equities move up quite a bit. One to watch and I am reminded looking at it that my ES daily rising wedge upper trendline was never hit. That would be in the 1270 area now.

On ES itself I'm seeing a gentle rising channel with support at 1241 and resistance at 1249 at the time of writing. That looks fairly solid and may well define the trading range today:

IWM broke the previous high with confidence yesterday and my upside target trendline for IWM now looks likely to be hit. That target is in the 79.5 area today:

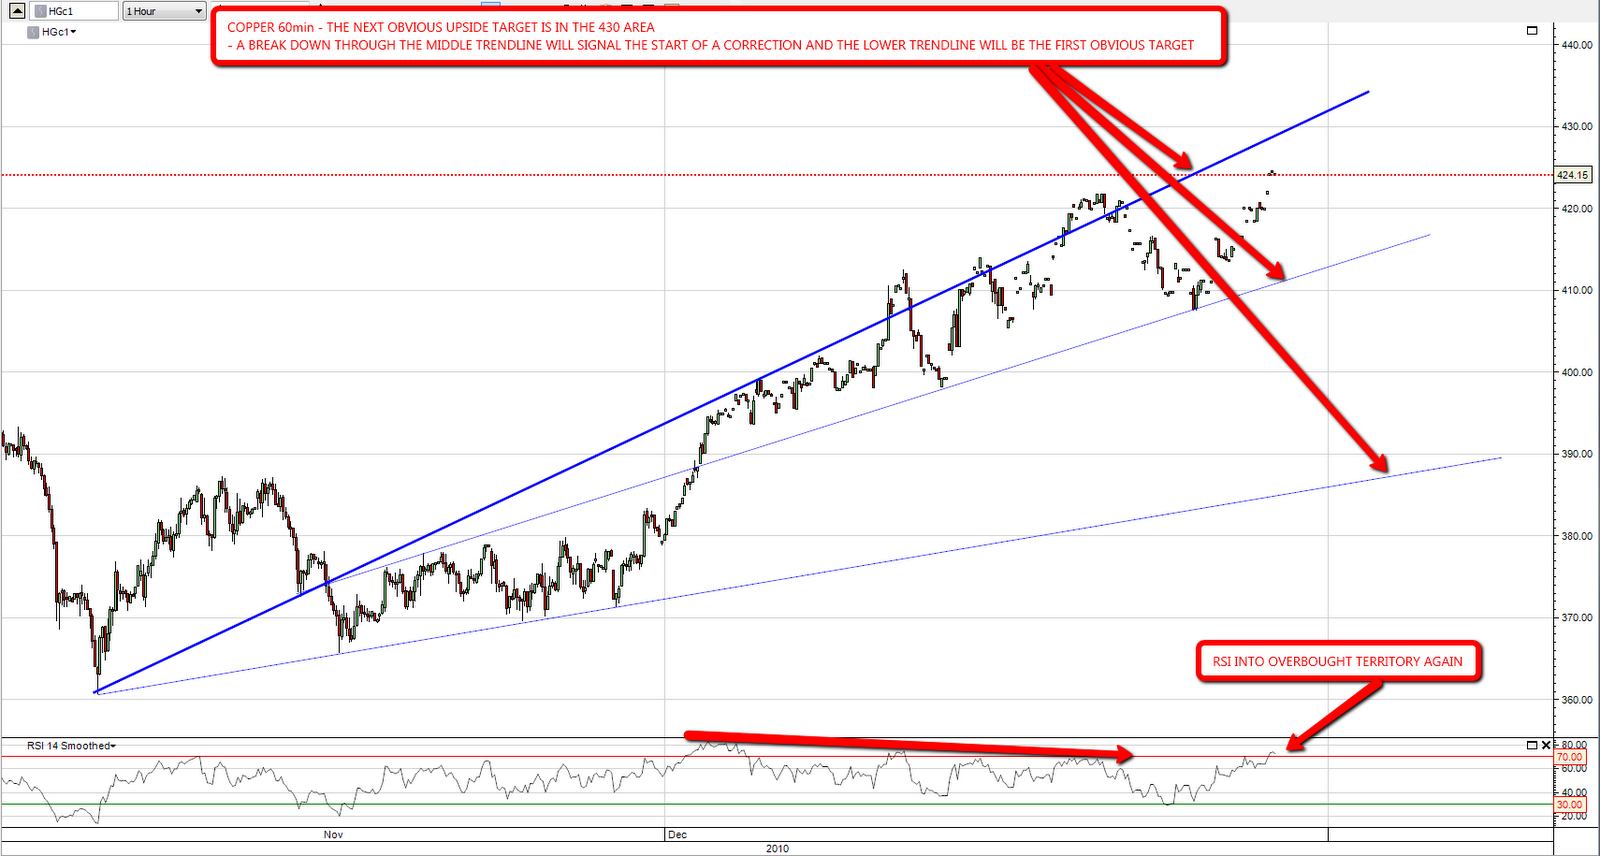
I've been having a look at copper this morning, and have a couple of observations to make. On the 60min chart there is a strong trendline running through the rise from 360, and if that is hit again then the upside target would be in the 430 area. I've drawn two trendlines below to show immediate and slightly longer term support:

On the weekly chart there is an obvious target for copper in the 440 area and that is pretty much the final major resistance trendline on the copper chart. if that is broken then the upside looks wide open, though I have drawn in a green trendline that would then be the trendline to watch.

I'm still very doubtful about seeing much downside on equities this week.

Shorts Update (by BKudla)

By -

On my blog and here, I posted on a number of short positions I have taken, with ERX this morning being my latest.  They are moving as expected, and wanted to reiterate that this move is just beginning, IMO. I commented in the charts below.  I am also short SPY PKX, PTR, and MCP (not pictured in this post).

As a caution, I am always moving stops to reduce my risks in case I am wrong.  I am only painting the idealized view.