Slope of Hope Blog Posts

Slope initially began as a blog, so this is where most of the website’s content resides. Here we have tens of thousands of posts dating back over a decade. These are listed in reverse chronological order. Click on any category icon below to see posts tagged with that particular subject, or click on a word in the category cloud on the right side of the screen for more specific choices.

A Bit More Upside, I Think (by Springheel Jack)

By -

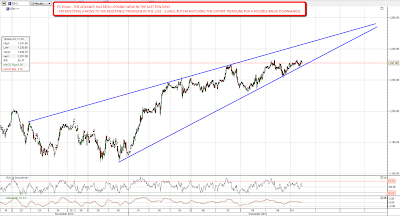
SPX has been trickling up on a daily closes basis the last few days, and there's still a bit more upside to come I think. For the conclusion of this wave up I'm still looking at the rising wedge from the summer lows, and that would put the target this week in the 1257 – 60 SPX area, so the 1252 – 1255 ES (March) area:

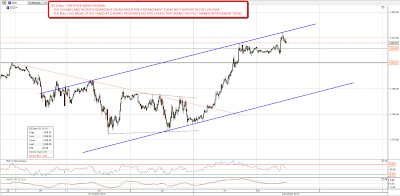
I have some doubts that target will be made though, and the shorter term charts aren't particularly encouraging in that respect. Looking at the 15min chart on ES (March) I'm seeing resistance in the 1242 – 44 area today if ES can make it off the support trendline. A break with confidence down from 1229 ES would most likely be followed by a significant further push down:
EURUSD is still making lower highs and lows but has been spending too long consolidating here. A more serious push up or down looks likely to start soon and I'm favoring a push down. That would most likely carry equities down with it to some degree:

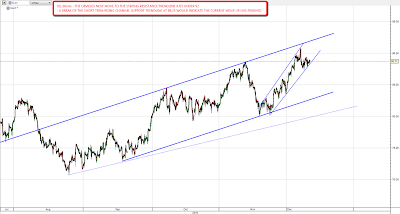
Oil is also stalled with the obvious next move seeming to be upward towards strong resistance just under $92. A break below $88.25 would suggest that oil won't make that target:
I'll leave you today with one of my favorite long term charts, which is the ten year weekly sugar chart. Sugar is looking toppy to me here, but the reason I like this chart so much is that it is a great example of some of the very strange short term moves one sometimes sees on futures charts. If you have a close look you'll see that there was apparently an opportunity to buy sugar at or very near zero near the end of 2003. Not something you see very often:

Shorting REE and MCP (by BKudla)

By -

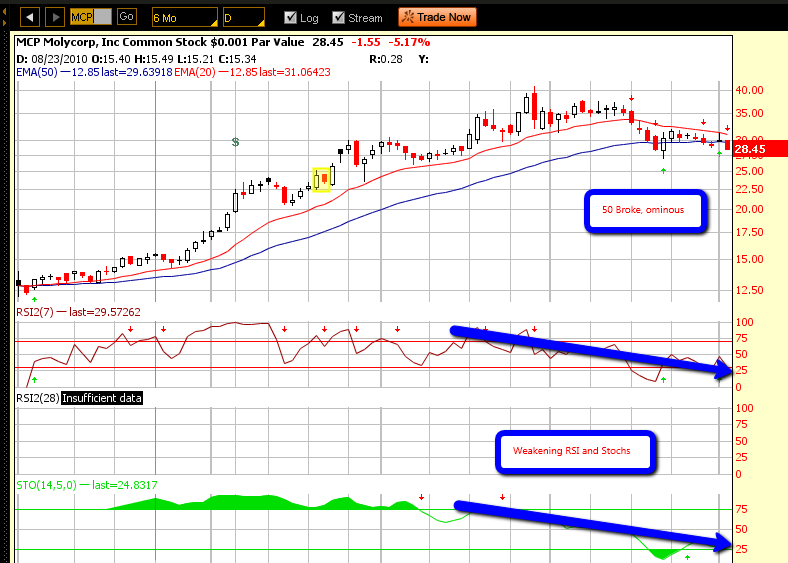
As I posted a month ago on rare earth companies being in a bubble are now playing out.  MCP has just broke the 50 and REE is hovering over it, with both sporting very weak relative strength and accumulation.  These stocks have a long way to fall and I will participate in this decline.

I also believe that the rare earth ETF marked the top.


Separating the Wheat From the Chaff (by BKudla)

By -

I have been watching the grain markets with great interest since 2008 when we entered into this cyclical cooling period.  As the earth cools it has a great impact on three major grain markets.  Canada, Russia, and Australia.  Russia has suffered a devastating collapse in their wheat harvests due to drought, Australia has gone from extreme drought to excessive rains and disease, and Canada's growing season has compressed due to early winter onset.

Two other macro issues are also in play, grains like all other hard assets are being bought to preserve wealth in the fiat folly policy underway around the world, and increasing middle class members around the world is raising consumption of said grains.  As a result, grain inventory around the world has slipped to 90 days, a 11% decrease over the past year.

So in my view a perfect storm is coming for the grains.

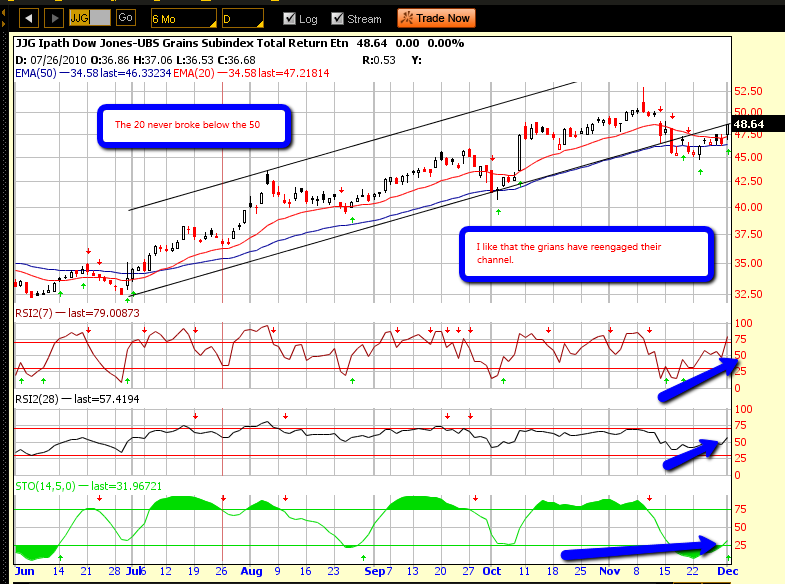
Looking at the chart of JJG, it is ready to reengage its upward channel.  When it broke below the channel the 20 never broke below the 50.  I am a buyer (scale in) as it slips back into that channel.

Personally, we have been stockpiling flour and sugar to give us a cushion, if need be (remember the rice shortage).

 www.arum-geld-gold.blogspot.com

Technical Tug Of War (by Springheel Jack)

By -

Well resistance was well and truly broken yesterday, and both ES and NQ made short term higher highs after higher lows. For my money the Santa rally is on and the question now is mainly about how far that will go.

Short term I'm looking for some retracement today, though there are some very bullish patterns in play and there is a risk that ES might spike up to 1220 or higher today if they play out. On ES I have a tentative rising channel with the upper trendline hit yesterday and again at a higher level overnight. The bull pattern here is obviously the bull flag indicating to 1222+, and I wasn't happy to see that breaking up this morning. However ES has since given up those gains and the higher high was on declining RSI so I'm still thinking a retracement looks likely. NQ made a lower high overnight which was also encouraging. If ES falls back to break 1200 then I'm expecting a return to channel support in the 1188 – 90 area,which I'd be regarding as a good buying opportunity:

The other bull pattern that I've been looking at this morning is the IHS that has formed within the EURUSD declining channel. The neckline hasn't been broken on an hourly basis yet but if it is then the pattern indicates to declining resistance in the 1.34 area, and I'd expect to see that made, as IHSes formed at a channel trendline tend to be very good performers. If that happens we might well see ES testing the recent highs by the end of the week:

I haven't much to add to that in the short term, so I've some other interesting charts to share this morning. The first is my chart of the bull market since March 2009, which has been a move of simple technical beauty. The recent highs and lows on SPX fit very well within the established internal support / resistance internal trendlines and it would suggest a target for this December rally in the 1250 area, unless of course it breaks up through into the next range:

The next chart is the long term copper chart, where we are just under massive long term resistance. A weekly close above $405 would look very bullish but right here just under $400 this looks a very courageous long:

I've been watching the recent meltdown in bonds with interest and found a nice broadening descending wedge on the TLT 60min chart that looks very tradeable: