Slope of Hope Blog Posts

Slope initially began as a blog, so this is where most of the website’s content resides. Here we have tens of thousands of posts dating back over a decade. These are listed in reverse chronological order. Click on any category icon below to see posts tagged with that particular subject, or click on a word in the category cloud on the right side of the screen for more specific choices.

XLF Narrowly Averts Bearish “Death Cross”

By -

XLF, the Financials ETF, is currently trading in a "triangle within a triangle," as shown on the Daily chart below. I'll be watching to see if price pushes and holds above the smaller one. Apex support is at 14.74ish and Apex resistance is at 15.20ish. Also, a bearish "Death Cross" formation has been narrowly averted, so far.

Strengthening Financials are important to any further advance on the S&P 500 Index, in my opinion, and this ETF is one to watch over the next days/weeks, particularly since it is still trading in the October 2008 lows and has never recovered to the 2007 high of 38.15.


Intraday Update on Russell 2000 and S&P 500 Indices

By -

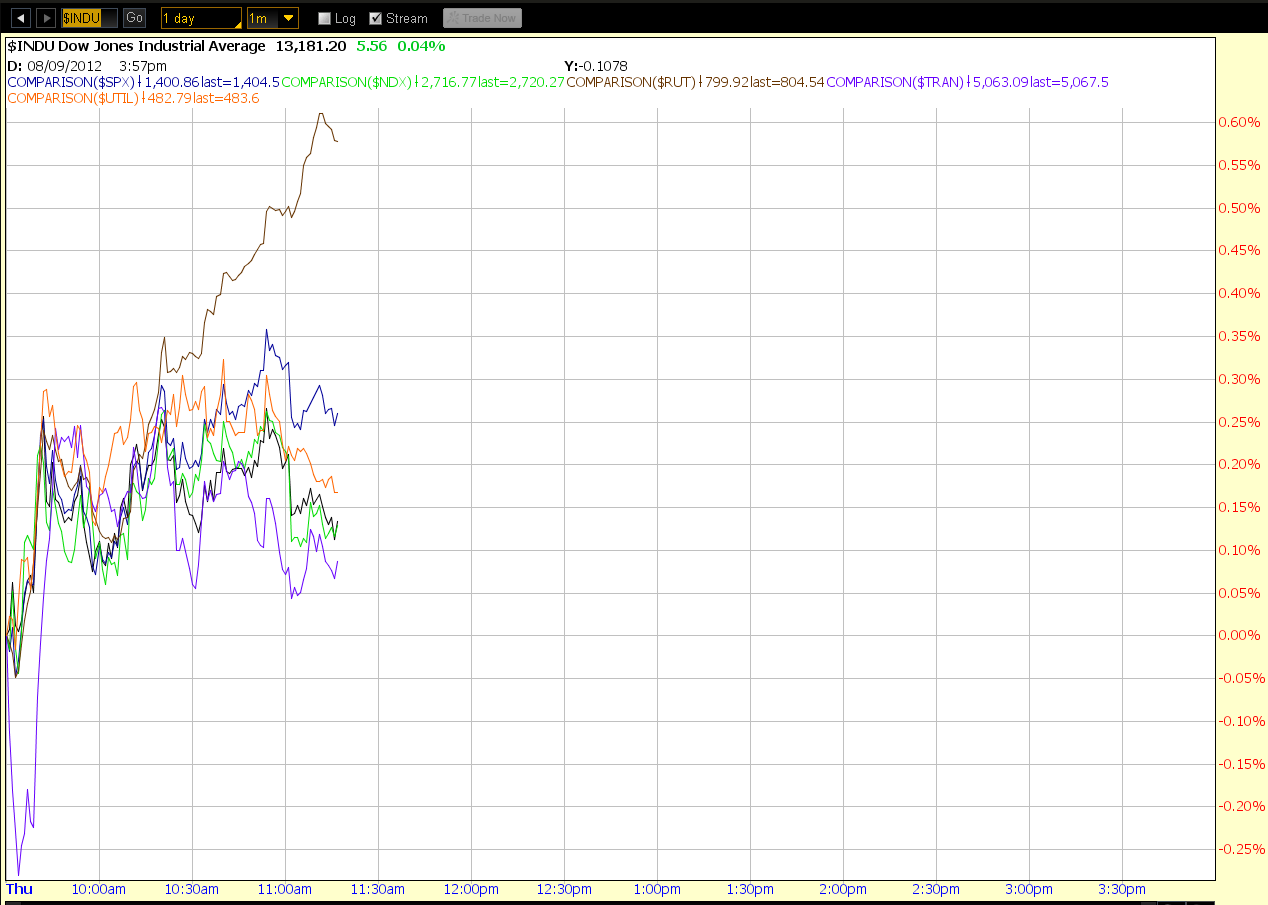
The Russell 2000 Index is in demand, so far, today, as shown on the one-day comparison chart below with its fellow Major Indices.

The RUT:RVX (Russell 2000 Volatility Index) Daily ratio chart below shows that the Russell closed above its downtrend resistance line yesterday and has advanced further, so far, today. The question is, can it hold onto its gains by the close today, and thereafter?


The SPX:VIX Daily ratio chart below shows the S&P 500 Index near the top of this week's action, so far, today…one to watch to see if it can advance and hold above its near-term resistance level of 92.50.


Money Flow for August Week 1

By -

Further to my last weekly market update, this week's update will look at the six Major Indices and nine Major Sectors in a very simplistic Year-to-Date line format, as shown on the two chartgrids below.

I like to look at this type of format when I get confusing signals from short-term, day-to-day choppy, whippy, and volatile price action in tight ranges. My conclusions will be based on the daily closes, rather than on candle highs, lows, and closes.

(more…)

Three-Day Update on the Major Indices

By -

Each candle on the charts below on the Dow 30, Dow Utilities, Dow Transports, S&P 500, Nasdaq 100, and Russell 2000 Indices represents three days. The current candle closed today (Thursday).

Each index is in a tightly-bound upward-sloping range, except for the Transports and Russell, whose range is sloping down. The current candle is a either a “Dark Cloud Cover”, or a “Bearish Harami,” which can signal a future bearish trend…the candle on the Russell is, simply, bearish…ones to watch for possible further weakness.