Slope of Hope Blog Posts

Slope initially began as a blog, so this is where most of the website’s content resides. Here we have tens of thousands of posts dating back over a decade. These are listed in reverse chronological order. Click on any category icon below to see posts tagged with that particular subject, or click on a word in the category cloud on the right side of the screen for more specific choices.

Consumers All Shopped Out Amidst Rising Prices

By -

Data for Store Sales released today shows that consumers reigned in their spending for the week, "driving the year-on-year to only +1.8% for one of the lowest rates of the recovery."

This was is spite of a rise in Personal Income for the month, while the price of goods (and housing) rose. Perhaps buyers are waiting for "back-to-school" sales before they part with any extra cash…or even paying off debt.

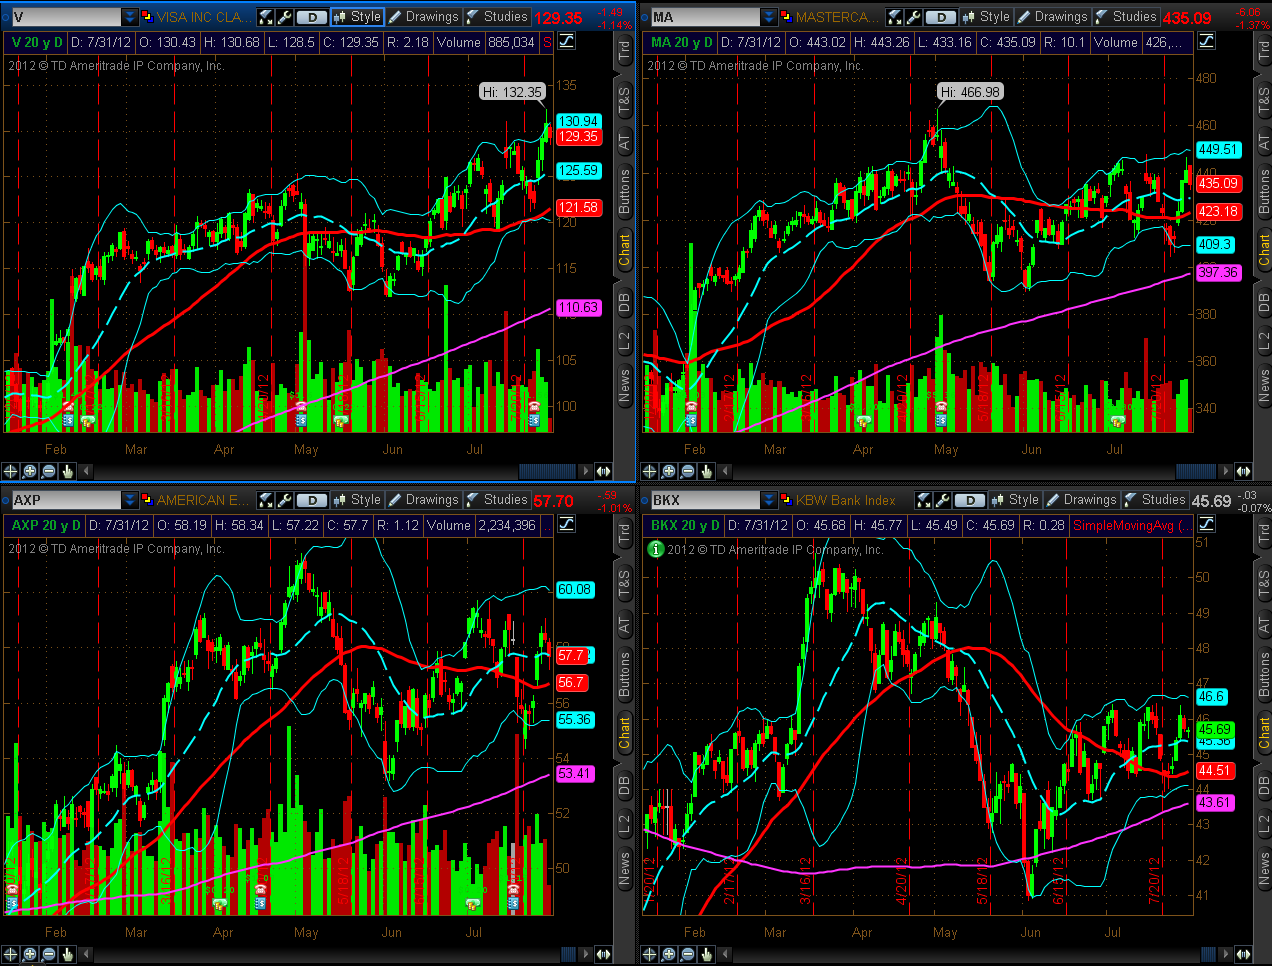
So far today, the credit card stocks are down from yesterday's close, as Visa pulls back from yesterday's all-time high…ones to watch for any further weakness developing.


The Fate of the Major Indices in Q3 of 2012

By -

Further to my post of June 29th, I thought I'd show where the Dow 30, S&P 500, Nasdaq 100, and Russell 2000 Indices are currently trading in their 2012 Q3 timeframe relative to the prior quarters. In that post, I mentioned that if the Q3 candle retested the Q1 lows again, I'd be very skeptical of much of a convincing advance above this year's high during these three months.

As can be seen on the updated Quarterly charts below, the current Q3 candle did, indeed pullback, but hasn't quite retreated to the Q2 lows, although the Nasdaq came close. Instead, an "inside" candle has formed, with price near the top on the Dow, S&P, and Nasdaq. The Russell is the laggard in roughly the middle.

(more…)

Money Flow for July Week Four

By -

Further to my last weekly market update, this week's update will look at the Major Indices and Major Sectors to assess strength vs. weakness in these groups during the past week.

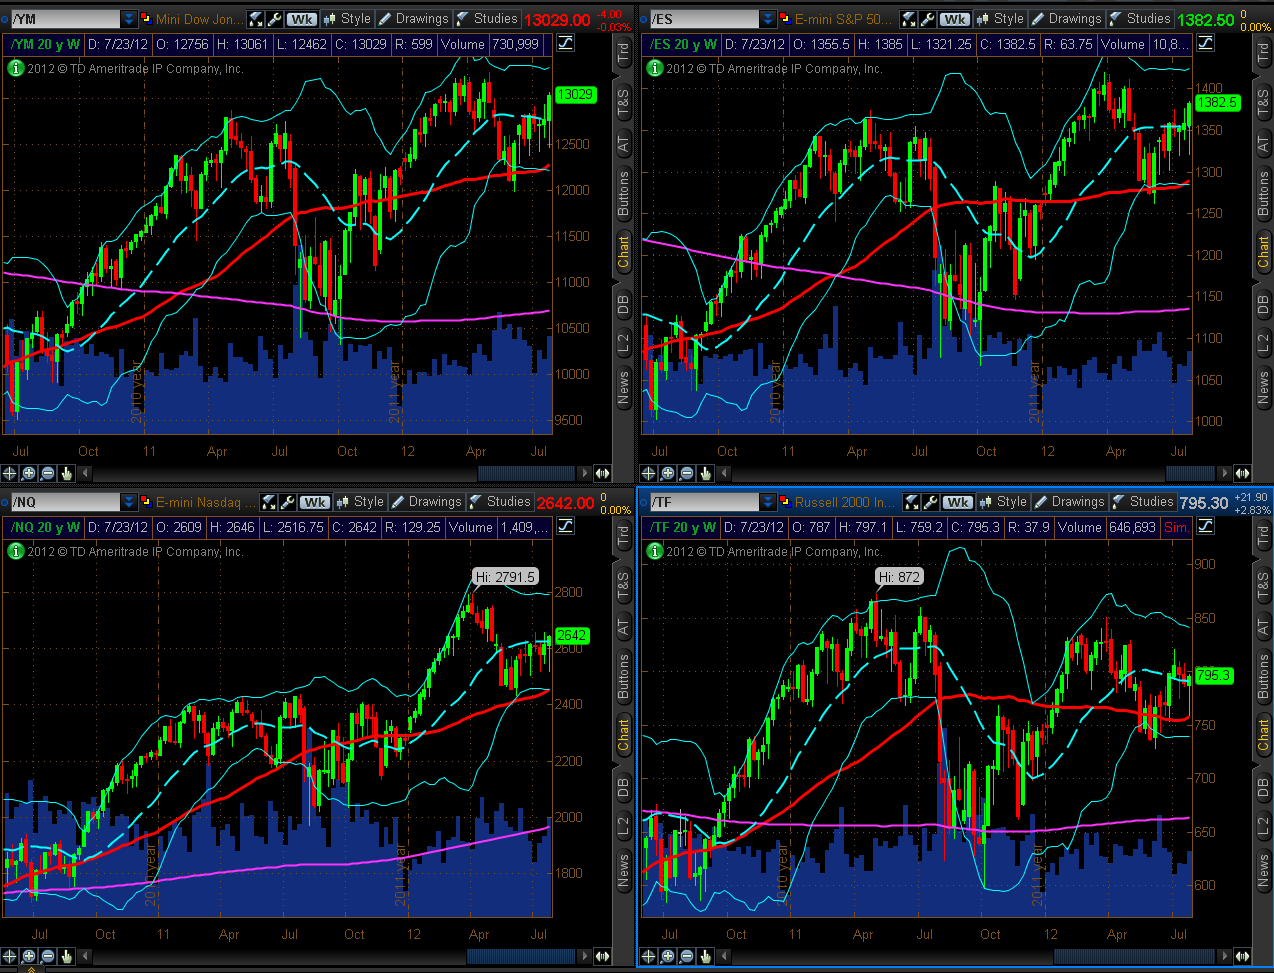
The Weekly chartgrid below of the YM, ES, NQ and TF shows that price has been locked in a tight upward-sloping trading range from their June lows, with market action see-sawing back and forth each week.

This is the first week since that time that all four E-mini Futures Indices have closed above the mid-Bollinger Band (for today's exercise, I'll refer to this point as their "mean" on the Weekly timeframe). All four closed near their weekly high.

(more…)

Will the 2012 Olympics Solve Britain’s Debt Woes?

By -

The 2012 Olympic Games will open this Friday in London, England. This news article mentions a cost to the British taxpayer of more than nine billion pounds, with a hoped-for return of 13 billion pounds over four years (as suggested by Prime Minister David Cameron). This seems like a pretty big gamble "at a time when Britons are struggling with a double-dip recession, rising unemployment and severe public spending cuts."

Data released on Wednesday shows that Britain's GDP dropped further into negative territory at levels seen in mid-2009, as shown on the graph below.
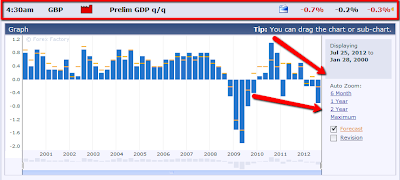
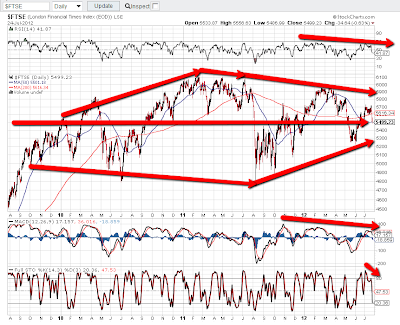
The Daily chart below of London's FTSE Index shows market action as at Tuesday's close of 5499.23. Major support lies at 5500, at the moment, and market action from mid-2011 is, basically, in a large trading range, defined by a triangle…in fact, this range extends back to 2009-2010 and is forming a large diamond pattern…potentially a topping pattern with a 1300 point range.

A drop and hold below this diamond could very well send London's equity index tumbling, possibly by 1300 points from 5500 down to the 4200 level, or lower…one to watch, along with future GDP data releases, as well as Libor fallout, over the coming weeks.