Slope of Hope Blog Posts

Slope initially began as a blog, so this is where most of the website’s content resides. Here we have tens of thousands of posts dating back over a decade. These are listed in reverse chronological order. Click on any category icon below to see posts tagged with that particular subject, or click on a word in the category cloud on the right side of the screen for more specific choices.

Earnings Season Begins (by Springheel Jack)

By -

The level of expectation for equities this year across the financial world looks highly bullish. With a budget deal done and the Fed pumping newly printed money into the markets there can be no stopping the rise of equities and the decline of the dollar. 


There is one obvious fundamental sticking point with this scenario in that as yet no budget deal has been done, and reaching such a deal doesn't look at all easy. There is a lot of speculation that will be finessed with the threat or actuality of using a poorly worded law to allow the printing of one or more trillion dollar platinum coins. That could happen in the looking glass world of US government debt but it may or may not prove to be legal to print a commemorative coin with such a high value.


The key though to this bull scenario should be the round of earnings reports and full year guidance that starts today. If these are impressively good then perhaps this bullish scenario for 2013 might deliver. If they disappoint then most likely not. 


From a technical perspective the action on the RUT and TRAN particularly looks bullish, though in the case of TRAN that will look more bullish once we see a break over the 2011 high, but the most obvious large scale pattern setups on equity indices are still the bearish rising wedges that have broken down on Dow and SPX. These may yet fail to deliver, but they are impressive patterns that strongly suggest more downside after another big high in the next few weeks, and until we see strong evidence to the contrary, I'll be bearing these in mind.


Unlike the SPX equivalent the rising wedge on Dow is still testing broken wedge support. This is an obvious level to see short term retracement or possibly major failure, unlikely as that seems today given current sentiment:

(more…)

Approaching Resistance (by Springheel Jack)

By -

I generally make a rule of posting no more than eight charts in a single post but I have nine today. Apologies to anyone who thinks that is too many but they're all worth including IMO. I've taken out three others including the Dow chart showing a second retest of the broken rising wedge support trendline close above yesterday's high. 

SPX punched up strongly through the upper daily bollinger band yesterday. This is a relatively rare occurrence and I've marked six previous instances of this on the chart below. Of those six, only the last one marked a short term high, and for this and other reasons I'll explain below I'm expecting at least some more upside before we get a significant retracement:

(more…)

Happy New Year! (by Springheel Jack)

By -

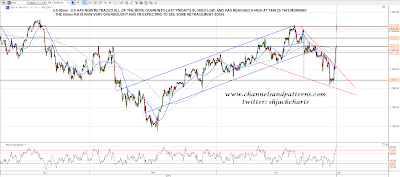
There are some days when the market moves so fast in the morning that some of my charting time seems wasted, and this is one of those mornings. Since I did my SPX charts ES has spiked up very hard, wiping out all of the losses into the close of last week and reaching a high of 1448.25 this morning. ES is now extremely overbought on the 60min RSI and I'm expecting some retracement, as well as a partial fill of the huge opening gap if ES were to hold the current levels at 1440+ into the open:

(more…)

Gold and Silver Updated

By -

Yesterday I made a post with the provocative title Silver is in a Bear Flag in response to some bullish headlines and well… silver’s Bear Flag, which remains intact and viable by daily chart.

A favorable bigger picture risk vs. reward situation was also
highlighted for gold and silver in that post.  Among the reasons for
this:

  • Technical upside potential appears greater than downside.
  • The inflation-dampening Operation Twist is now put in the rear view
    mirror in favor of good old fashioned T bond and MBS Monetization.
  • The Commitments of Traders structures are improving.
  • Sentiment – especially among gold newsletter writers tracked by Mark Hulbert – is in the dumps and contrarian bullish.

Importantly, there is also the value proposition
of gold, which has not changed throughout the long and bullish
consolidation these last 1.5 years.  By the graph below, courtesy of the
St. Louis Fed, it has not changed since the beginning of the secular
bull market either.

(more…)

Silver is in a Bear Flag

By -

Seeking Alpha has only 3 entries under the ‘Gold & Precious Metals’ section of its most recent ‘Macro View’ email notice:

  1. Silver: Another Decade of 500% Returns is Possible
  2. Silver: Are We Ready Yet for the Rally to $60+?
  3. Silver is Set to Explode in 2013

To be fair, the second article highlights lower near-term targets
prior to a rally to $60+ and this brings me to my point; silver is in a
bear flag.  I too am bullish on Ag and Au in 2013, but the charts are
the charts and silver’s daily chart targets 27-28 first, which we have
been noting in the newsletter despite a recent change to a bullish risk vs. reward stance on the precious metals complex.

silver

Bullish risk vs. reward (meaning gold and silver have notably more
upside potential than downside risk) is one thing and short-term
technicals are another.  The short-term technicals say to be ready for a
lame rise to the noted resistance level (31 had been important support
before its failure) and the potential for a renewed decline to strong
support in the 27 to 28 range.

I am sure the above noted articles are not the only three out there. 
When the silver bugs are beating the drum loudly and the technicals are
not yet in line, it always pays to be cautious in the near term.

On the bigger picture using the weekly chart for example, silver’s
technicals look fine.  But that should include the potential for a drop
to the mid-high 20′s because despite a bullish macro fundamental view
and even longer-term technical view, the recent correction is not yet
indicated to be over.

What might we look for?  A final, dispiriting decline with sentiment
bottomed out and the CoT (Commitments of Traders data) going to a full
bullish structure (it is moving in the right direction) and some
positive technical divergence (like that noted on the chart above from
last summer) would be an excellent setup.

And if I am being too bearish on the short-term, we’ll know soon
enough with a sustained rise above the noted resistance area at 31,
which also includes the 200 day simple moving average (solid red line).

Just a word of caution and perspective from your friends at biiwii.com ;-)