

Slope of Hope Blog Posts

Slope initially began as a blog, so this is where most of the website’s content resides. Here we have tens of thousands of posts dating back over a decade. These are listed in reverse chronological order. Click on any category icon below to see posts tagged with that particular subject, or click on a word in the category cloud on the right side of the screen for more specific choices.

Liquidity & Money Supply (by Gary Tanashian)

By -

Hello SOH, below is an excerpt from a recent newsletter having to do with money supply.  This is the all-important indicator on when 'Prechter is going to be right' once again and of course, for how long……

Excerpted from NFTRH68 dated 1/17/10:

Let’s
not get hung up on doing the stock market today. Friday was Op/Ex, the
market took a bit of a tumble and the construct generally remains as it
has been; high risk and extended. Technicals remain the same. Full
Denial ’10 chugs on until it doesn’t.

Let’s do get hung up on liquidity however, since this is FrankenMarket’s
primary fundamental underpinning or as the graphs show, increasingly
lack of underpinning. M2 has leveled off in alignment with our theme
that it is now time for the economy to prove itself on its own merits
(or lack of same). The panic of 2008 into 2009 has been followed by [the predictable 'recovery’] we now enjoy. Why, they have even terminated the gray
area on the graph. Recession over I guess.

M2

MZM is actually declining slightly. These graphs mesh with the idea
that a deflationary event is still in play. Ironically (and sadly), in
the age of inflate or die, policy makers need a disaster from which to
come to the rescue.

Mzm

The setup argues that the long bond will turn up and negate the Head
& Shoulders, which it is posturing to do. If this happens, the
‘inflation trade’ is going to be halted in its tracks.

Usb

Meanwhile, Nowandfutures.com
has a nice recreation of the M3 money supply data, which most readers
will know was discontinued as irrelevant by the US government. Here is
what Nowandfutures.com has to say about its M3 calculation:

“We
did some sleuthing and data extraction and put M3 back together from
various weekly Federal Reserve reports that are still available.

  1. The formula we're using has five 9s correlation to the original data back to 1980.
  2. There
    is only one missing element that is apparently no longer available
    (Eurodollars) and an adjustment has been applied to generate it. Its
    only about 3% of total M3 so should not have a material effect on the
    total.

Here is our article
on M3b, which details our work and notes the sources for the data. Note
that as of Nov. 10, 2006 the Eurodollar estimation formula has changed
– see the article for details.

John Williams' monthly reconstruction of M3 is here
. Ours tends to be more volatile and averages slightly higher than his,
partly because it's weekly and partly because of our minor differences
in calculating the Eurodollar component of M3 and repos.

Finally and to put M3 into proper perspective with inflation (as measured by CPI without lies), the M3 and M2 strong inflation link is virtually unquestionable. The longer term inflation picture is clear, although M2 shows a pause and likely temporary disinflation as of 2008 [emphasis mine –GT]. Certain bloggers are incorrect and have continually avoided these facts and the linked chart."

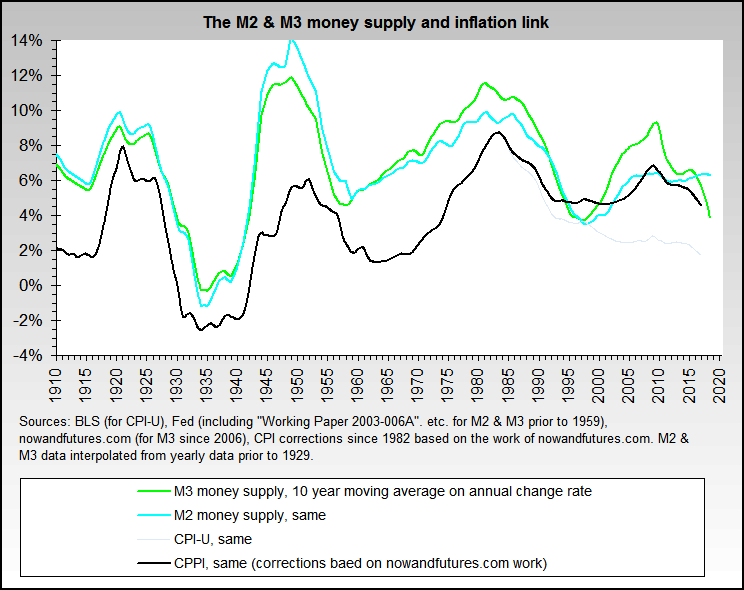
M3b

The Long View (by Springheel Jack)

By -

There's been a lot of talk everywhere in the blogosphere in recent months about Prechter's dismal forecasting record, and much further talk about how this has demonstrated that Elliott Waves are useless as a forecasting tool.

Well, maybe, but it is perhaps a mistake to blame EW rather than Prechter himself. Prechter's forecasting record over the last twenty-five years is so poor that his decision to continue publishing his forecasts is a tribute to his dogged persistence rather than his good judgement.

I grew up in a shooting family, and to my embarrassment was always a very indifferent shot. As luck would have it my younger brother was a very good shot indeed, which was a bit dispiriting for me whenever we shot together as children.

Now an outside observer watching my brother shoot then would have concluded that whatever he was shooting with was an accurate weapon. Watching me shoot the same weapon instead might have led the same observer to conclude that as a way to make a hole in a barn door at fifty paces, it was a poor substitute for a bow and arrow, but that would have been to mistakenly blame the tool rather than the workman. 

In the same way it would be a mistake to discard EW just because Prechter is a much better writer than forecaster.

I was looking at a very interesting chart this weekend, which was the chart for the 1937 crash and subsequent rally and decline:

100125 Crash 1937 Fib Retracement

Now that rally did an almost perfect 61.8% fib retracement of the previous decline, which led me naturally to compare that the recent high at 1150 is much less satisfying as a top for Primary 2 from a fib retracement perspective. I have been expecting 1230 for a similar retracement after the 50% fib was convincingly broken. That might still be the case, but a lot of technical damage was done last week, and I haven't seen this many longer term channels break since March/April last year so …

I had another look at P1, looking at SPX rather than Dow, and found something that looks interesting there:

100125 SPX EW Count Wave 1 Incomplete

Ignoring Prechter's oft-stated view that there were a perfect five subwaves down between the high in October 2007 and the low in March 2009, I came up with a different and to my eye at least, more convincing interpretation that there were only three subwaves down to the March low.

On this reading the rally since March has been a fourth wave retracement of the third wave that has made an almost perfect 61.8% fib retracement of that third wave.

That would be good news for bears because it would mean that this rally has most likely topped now. The bad news is that we are only now starting the fifth subwave down of P1 rather than P3, though a new low would still be more than likely.

That would fit my longer term expectations much better. We are in a secular bear market that is likely to last several more years before a new secular bull market cycle begins. Private deleveraging after this massive credit bubble has only just got started, and the public credit bubble has yet even to make a peak. 

On my count above we would spend the next year or so finishing P1, and would then have a P2 'bull market' lasting a couple of years, and then the P3 decline would start at a time when government finances and creditworthiness are too degraded to allow a repetition of the interventions that we have seen in recent months. 

After P3 had then completed in 2016 – 2020, we would then have see the equities revulsion low that would be the prelude to the next secular bull market cycle. 

If one were to take the all-time highs in 2007 as the (non-inflation adjusted) bull market high rather than 2000, which I have seen many analysts do, then a nine to thirteen year secular bear market cycle might also give a perfect 38.2% to 50% fib time retracement of the 1982 – 2007 bull market.

I have always had trouble seeing the final wave down of this secular bear market starting now or even soon. I take the view that we have seen a three phase debt bubble over the last fifteen years, of which the private corporate debt bubble phase took place in 1995 – 2000, the private personal debt bubble phase took place in 2003 – 2007, and the government debt bubble started in 2008/9 and is still expanding fast. Until this last bubble bursts, which shouldn't take more than two or three more years by the look of it, then no broad-based rebalancing of the western economies away from debt can really get going.

EWI Takes the Gloves Off

By -

The market has been frustrating a lot of folks, not the least of which our friends at Elliott Wave International. However, they have finally issued their clearest "this is it!" proclamation as of Friday's STU…….

 0116-wave3

Of course, what would STU be without some wiggle room in the text somewhere?

0116-weasal

In other words, "this is what's happening, unless it's not." Joking aside though, I always respect clear projections and declarations. EWI's chief Bob Prechter is no less clear, and his view of a bear market isn't the least bit forgiving. Observe:

0116-WAVEC
Yes, that's a level of about 400 or so on the Dow. I'm not even sure a nuclear apocalypse could produce that kind of result, but there you have it.

So at this point, a number of folks I respect have projections all over the map……..

  • Evil (molecool) is in "hibernation mode";
  • Gary Savage is going for an all-out bull market in gold and silver;
  • Good ol' Tim is still in a grind-it-out bear market mode, but with an ultimate low closer to 6000 than 400!

The handful of longs that I had, I sold on Friday morning. I am 100% short, although 40% of my portfolio is in cash, and I still have used $0 of margin. All the same, a 60% commitment is the highest level I've been at thus far.

Fans Lines of the Ages

By -

This weekend has still been very much in "Mind-Whirling" mode. I have also been in constant contact – in person, on the phone, and via email – with a variety of folks from the trading world – – all of them whip-smart, and all of them as bewildered at the market as me. It's comforting to know that I'm not the only one scratching a valley into my scalp.

Since 90% of my invited guest writers seemed to have skipped town, and the only 10% contribute every now and again (which I appreciate, believe me), I am sometimes feeling a bit short on material: particularly on a Sunday morning, when I emptied my modestly-sized noggin out the prior day..But I landed on one interesting item I've noticed, which is the extremely long-term Fibonacci Fan lines on the S&P 500.

I've drawn a couple of them, both of them starting July 8, 1932 (yep, nearly 80 years ago) and ending on March 24, 2000 (for one) and October 11, 2007 (for the other). The lines, over the decades, have been amazing guideposts for market action. For instance, during the 70s:

0110-70s
 

……..in the late 80s and early 90s……..

0110-80s
 

So what does it tell us today? Well, the S&P seems to be facing off with two of these levels. As you can see in the chart below (and take note how, last March, it bounced beautifully off the 61.8% line) we are just about precisely at one of the fan lines (suggesting a resistance level) and about 75 points away from another fan line (from the other series).

0110-current

So what this tells me is that, unless we get some weakness almost immediately, we're in for about another 75 S&P points on the upside, coinciding with very late March/very early April (which kind of plays well into the "people will start selling for tax reasons in March" scenario).