On this quiet Sunday, before what promises to be another dynamic trading week, let’s look at a few real-estate oriented ETFs. Starting off, we have the SPDR Homebuilders, which has been carving out a series of lower highs recently. As long as it stays beneath 42.86, this is still a clean downward pattern (we even “teased” a break of the topping pattern already).
Slope of Hope Blog Posts
Slope initially began as a blog, so this is where most of the website’s content resides. Here we have tens of thousands of posts dating back over a decade. These are listed in reverse chronological order. Click on any category icon below to see posts tagged with that particular subject, or click on a word in the category cloud on the right side of the screen for more specific choices.

The Interesting Trio
I see that the brief recess we got from braggadocio is gone. Not only that, but he explicitly mentioned the stock market again as evidence of how great things are. So, yeah, our time machine back to January 26 apparently works!

The Bottom in 10-Year Treasury Yield Signals a Change of Era
by Michael Paulenoff, MPtrader.com
Summary
- The bear market for benchmark 10-year Treasury yield is at its end – disruption is coming
- Numerous indicators corroborate: we are in the midst of an economic transition
- Will the Powell Fed quickly evolve into a strong counter-balance to the powerful economic transition?
- On an intraday basis, we explore these overarching themes overlaid on price behavior in my private investing community at MPtrader.com.
Take a close look at the monthly chart of benchmark 10-year US Treasury yield (Fig. 1) for the period 1981-2018, a 37year period. The dominant bear market for yield may still be alive but is not necessarily all that well.
Bonds and Related Market Indicators
The following is an excerpt from this week’s edition of Notes From the Rabbit Hole, NFTRH 488. For NFTRH bonds are not just an asset class ‘throw-in’ but instead are a key indicator set to the entire modern macro. Insofar as it may be time to use them for portfolio balance (I am currently long SHV, SHY, IEI & IEF), so much the better. Many could not wait to buy bonds during US ZIRP global NIRP operations, but today they pay better interest and have a contrarian edge with the entire herd bracing for a bear market.
We claimed appropriately bearish on bonds on December 4th, so you know this is not perma-book talking when we go the other way as yields hit our targets. (more…)
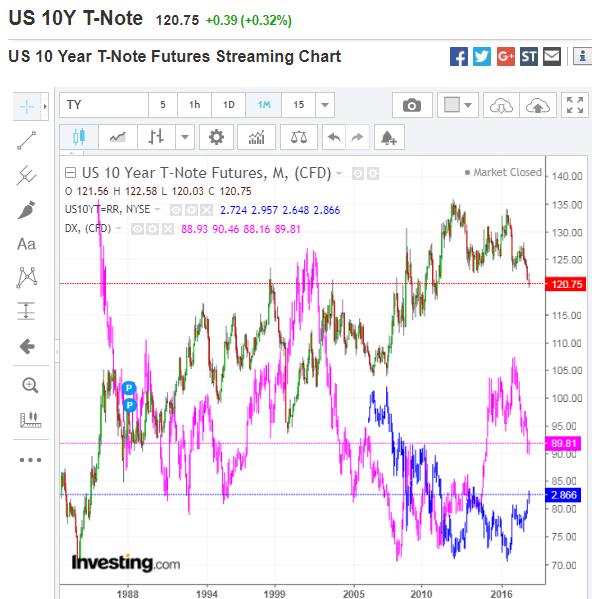
US 10YR T-Note: Major Support & Resistance Levels
I last wrote about the 10YR T-Note, 10YR Rate, and the US Dollar (DX) here.
The following monthly comparison chart shows the price action of all three. The US Dollar, generally, trends in the same direction as the 10YR T-Note, but has seen much more volatile swings. The 10YR Rate has recently broken above a very long-term downtrend line and is threatening to break above 3%, a level last hit in January 2014.