
Slope of Hope Blog Posts
Slope initially began as a blog, so this is where most of the website’s content resides. Here we have tens of thousands of posts dating back over a decade. These are listed in reverse chronological order. Click on any category icon below to see posts tagged with that particular subject, or click on a word in the category cloud on the right side of the screen for more specific choices.



Prechter was Right About Munis
OK, let's give the man his due. Prechter has been very bearish on municipal bonds for a while. He was 100% correct. Here's an ETF that follows them:
Bouncing Yen, Collapsing Bonds (by Springheel Jack)
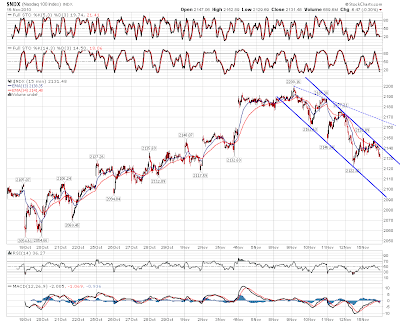
There's not much to say on equities today. Obviously SPX is still in a declining channel, and the next downside target is in the 1184 – 1186 area, depending when we hit it today. There is obviously a chance that won't be hit, but support at 1195 SPX broke overnight, and I think a downside trendline hit is now more than likely. After that hit the upside target will be in the 1200 – 1202 SPX area, and a break up from the declining channel will signal that this retracement may well be over, though if this has just been the A wave of an ABC retracement, then there may be more downside coming after a bounce. Here it is on the SPX 15min chart:

The declining channel on the Nasdaq isn't as pretty, but looks just as playable, and the downside target is slightly under 2100 today:
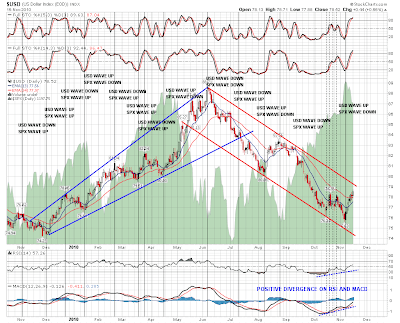
In terms of USD, which is the driver of so much of what we see on equities in these days of devaluation and runaway monetary inflation, we have almost reached the top of the declining channel on the daily chart, which I have at slightly over 79. Obviously once we reach it we then see whether the declining channel holds, and USD resumes its plunge into oblivion, or the declining channel breaks, and we see a bounce back to the weekly triangle target in the mid-80s. That could still go either way think. Obviously the Fed is determined to devalue USD, and they are in a position to deliver that, but equally the trading partners (and creditors) of the US are not happy to let them do that, and we don't know yet how that disagreement is going to play out. Here's the declining channel on the USD daily chart:
One thing that has been comical to watch over the last three years has been the flight to safety trade, where whenever equities have fallen, we have seen a flight to areas of perceived relative safety notably, and amusingly, to US treasuries and the Yen. That's amusing, as a flight to safety, because it has seemed increasingly unlikely over this period that the US will ever be able to repay its debts, and Japan, several years ahead in this respect, is already insolvent on any reasonable basis, with a debt in terms of GDP per head that is 50% higher than in Greece.
For whatever reason, and we should definitely consider the possibility that it is because there is now no perceived risk of a major decline in equities in the near future, the flight to safety trade has collapsed on this current equities retracement. Yen is retracing from close to an all time high. On the USDJPY chart that is reversed of course, so that's playing out as a bounce from support with the obvious target being 86 to finish the head on an IHS. Here it is on a 17 year weekly chart:
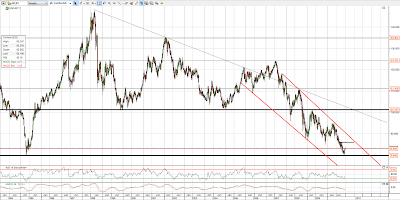
On US treasuries the start of QE2 is having a similar effect to the one we saw at the start of QE1, with a major fall in bonds and spike in long term US interest rates. So far these have spiked from 3.5% in the summer to almost 4.4%. The obvious long term resistance trendline is at 4.7% and they may well reverse there, though there is a very real possibility that the thirty year bull market in bonds ended in late 2008, and that interest rates will break resistance and go much higher. Here's the 20 year monthly $TYX chart for 30 year T-Bond Yields to show what I mean:

The bond chart is possibly the most important longer term chart to watch nowadays, as for all its impressive power to print money, unless the Fed is happy to mop up all demand for treasuries just by printing money, it still needs to maintain confidence in bondholders that they will get their money back. That is complicated by the fact that many US treasuries are held overseas and that the Fed must keep yields and thereby interest rates low in order to protect the US economy from an interest rate shock. If $5 trillion of US treasuries is held by foreigners, and that appears to be about right, then a 10% devaluation in USD is effectively a $500bn windfall tax on foreigners holding US treasuries that yield a small fraction of that. Small wonder that enthusiasm for USD devaluation is very limited outside the US.
The US Dollar Bounce (by Springheel Jack)
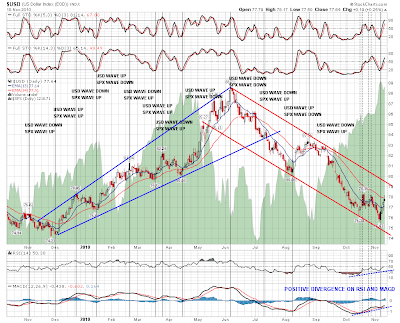
So much market forecasting nowadays comes down to the direction of the US dollar, and that's the main issue this week too as I see it. USD has bounced, eventually, off triangle support on the weekly chart and more importantly off declining channel support on the daily chart. The obvious target is the top of the channel and the question today is the likely path it will take to get there. Here's the declining channel on the daily chart and, for the benefit of anyone who is still skeptical about the effect of USD on equity prices, I have used my daily chart with SPX as the background, and with the wave relationships between USD and SPX marked on the chart:
EURUSD is 55% of the USD index of course, and so acts as a good inverse proxy for USD for charting purposes. I chart this directly from the forex markets as those markets are very deep and liquid, and not therefore prone to the strange short-lived spikes up and down that appear on the USD futures chart from time to time. On the EURUSD daily chart the rise from the June low is in the form of a broadening ascending wedge, which is normal for EURUSD, which generally trends in a wedge of one type or another. Wedge support is in the 1.32 area and EURUSD has fallen back to the strong support level at 1.37. The question is what happens here?
There are two paths for EURUSD to take from here in my view. The first path is to complete the H&S pattern that appears to be building, by bouncing back over 1.40 over the next few days to make the right shoulder for the pattern, and then to fall to wedge support. The second is for EURUSD to break support at 1.37 on a daily close basis and then head straight towards wedge support:

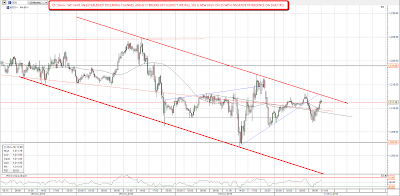
For that reason I also have two scenarios for ES / SPX over the next few days, and they are directly linked to those two EURUSD scenarios. If EURUSD doesn't break support and makes the right shoulder on that H&S, then I'd expect ES to make a new high, with negative divergence on RSI, and we'd see an interim top made there that should last two to four weeks in all probability while ES / SPX and EURUSD both correct. If EURUSD breaks support at 1.37 then we should see both go significantly lower over the next few days. If we're taking the second path, then there's a declining channel on ES that I'd expect to see hold, and here it is on the 15min chart. Resistance is just under 1213, and I'm short until that breaks up. If we make it to the lower trendline of the declining channel today, then that should be hit in the 1194 – 1195 area:
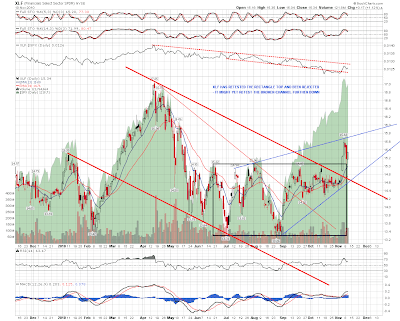
I've been watching XLF with interest since the break up a few days ago. It has returned to retest the broken rectangle in recent days and that has held so far. The next obvious target is the rectangle target in the 16.8 area, but I'd be reluctant to play that unless ES breaks up from the declining channel. If ES continues to correct from here, then I'd be wondering about a possible retest of the broken declining channel and that would look like a very attractive long entry if XLF reached there:
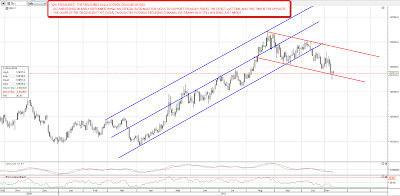
I mentioned at the beginning of September that one stated purpose of QE2, to support treasury prices, was a polite fiction, and that the real intention and effect would be to support equity prices while treasuries would trend sideways to down at best. Looking at the chart for 30 year treasuries today, I'm not seeing anything to change that opinion, although I might eliminate the word sideways from my forecast. Expect more downside, though treasuries could well bounce here as they are at the lower trendline of a possible declining channel:
Down Move Not Finished Yet (by Springheel Jack)
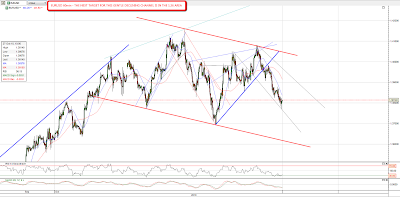
After yesterday's recovery and gap fill there was more more weakness on ES and EURUSD overnight. It seems likely that there is more downside coming because EURUSD is still well short of the channel target in the 1.36 area. I had drawn a trendline for a likely interim bounce from EURUSD overnight and so far it has bounced 55 pips from the hit there so I'm expecting EURUSD to bounce a bit more before the decline resumes. I'd normally expect to see a small declining channel on a move like this and if so, the short term target will be in the 1.39 area if hit today:
On the basis that the current EURUSD move doesn't look finished, I'm also expecting to see further weakness in ES this week, though with EURUSD bouncing in the very short term, it's possible we may not see much more downside today. On the ES 5min chart I'm looking for a bounce that could reach the 1182-4 area in the short term and then another move down, possibly towards 1167, to complete the head on a possible head and shoulders pattern:
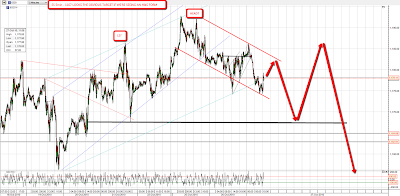
That 1167 target isn't quite as speculative as it might seem from the ES chart. A natural support level for a retracement is the SPX daily 20 SMA and that was at 1167 SPX at the close yesterday and is rising of course so it will be a little higher today and more so tomorrow so if we hit it tomorrow the ES and SPX targets will be close to each other. On the SPX 60min chart I'm seeing support for the current (green) rising channel in the 1175 SPX area and that is the minimum target that I'm expecting to see hit:

One thing that we've not been seeing on any weakness in recent days is a flight to treasuries. Just the opposite and it is very clear now that we're seeing a significant correction on long treasuries:
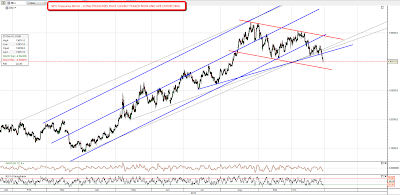
Why have treasuries not been boosted by any weakness in ES? Well bonds tend to trend down as equities trend up and equities really have been trending up for a couple of months now. I've been saying for months that any substantial QE2 push would be likely to send bonds trending sideways to down while equities trend up and the direct effect of QE2 on bonds, if any, will be only to cushion any fall.
There's also the fact that the technical position for equities looks so strong here that people are viewing any dip as a buying opportunity rather than a cause for alarm. Even the bears are mostly just looking for a dip towards 1130 SPX here, and there's every reason to think that might happen, with USD having bounced off strong support and commodities looking ripe for a correction. I was looking at the CRB chart yesterday and it is looking very toppy. It has also tracked EURUSD closely over the last few months so a correction in EURUSD should deliver the same in commodities:

