Slope of Hope Blog Posts

Slope initially began as a blog, so this is where most of the website’s content resides. Here we have tens of thousands of posts dating back over a decade. These are listed in reverse chronological order. Click on any category icon below to see posts tagged with that particular subject, or click on a word in the category cloud on the right side of the screen for more specific choices.

Christmas Week Begins (by Springheel Jack)

By -

I was asked an interesting question last night, and it was in response to my saying that we had been chopping around in the same area for a week, which is generally a good signal that a top is being made. I was asked how many such formations had turned out to be consolidations in the last two years on SPX and I estimated fewer than one in three. Looking at it this morning the correct answer is actually much fewer than that, if the formation is well above the daily 20 SMA when it forms:

We've also hit support on Vix on Friday on the daily chart, where the resistance trendline for the year to April 2010 has since been a strong support trendline:

That's not to say though that we can't rise a bit further and I see on the ES 15min chart this morning that a megaphone has formed overnight that indicates to the 1250 area on an upward breakout. It may just be an overthrow but it appears to be breaking up, and I see that ES has now reached a level slightly higher than the previous highs a week ago:

EURUSD was weak overnight and is stalling again at a level that looks very significant on the USD chart. If this resistance level on USD breaks then the way looks clear to rise to the next significant resistance level at 83.65:

TLT has reversed earlier than I expected, and looking at the chart this morning what I thought was a broadening descending wedge is resolving into a falling wedge. The upside target for this move up is therefore in the 96.5 area:

Which way am I leaning this week? Well if it wasn't Christmas week I'd be leaning strongly short. However it is Christmas week and it will be a low volume, heavy POMO week so I'm a bit doubtful about seeing much in the way of downside on equities until the week after Christmas which is a very different story. Last year there was a decent correction to the 20 SMA on SPX in the week after Christmas as you can see on the top chart. Meantime I am very aware that my rising wedge target on ES is in the 1265 area now and it's still just possible that could be reached. We'll see.

Short Term Top Made? (by Springheel Jack)

By -

Just a quick post today as I'm very busy with offline stuff. ES made a marginal new high yesterday with negative divergence on RSI, and it seems likely that a short term top is in. Due to the channel and pattern desert that we have seen in this latest wave up it isn't easy to put a retracement target on this but I'm leaning towards the 1215 ES (Mar) area for a number of reasons. The technical rising wedge target is in the 1212 area and to get there some strong support in the 1230 area must be broken:

On EURUSD we are seeing a correction and the first target is in the 1.324 area. If that breaks then I'm seeing channel support in the 1.307 area:

I posted a broadening descending wedge on TLT a few days ago and it has been making good progress towards my downside target, which still looks ambitious though. We'll see if it can reach 87 – 88:

I've been enjoying some of the text to video xtranormal videos posted in recent days. I've made a contribution myself explaining the thinking behind current US economic policies. You can see it here on YouTube.

Impact of Higher Yields (by Mike Paulenoff)

By -

The ProShares UltraShort 20+ Year Treasury ETF (NYSE: TBT) is pushing up through important 6-month resistance, which projects considerably higher and is another way of saying that the yield curve could get considerably steeper in the near future.

If that proves to be the case, then major money center banks that provide loans should be able to capture a much wider spread (profit-margin), especially if the Fed holds rates at zero for the foreseeable future, as Chairman Bernanke suggested on "60 Minutes" last Sunday evening.

Add in the income and payroll tax cuts, and perhaps loan demand will begin to surge, all of which could be extremely bullish for big banks like Bank of America (BAC). Finally, from a technical perspective, BAC appears to be about to thrust out of a 4-session bull flag formation in the aftermath of its recent upmove from 10.91 to 11.88, which should propel prices directly to test its Apr-Dec resistance line, now at 12.33. If hurdled, this will trigger a powerful follow-through to test the prior rally peak at 12.76.

LtKJdbIZG
Originally published on MPTrader.com.

Technical Tug Of War (by Springheel Jack)

By -

Well resistance was well and truly broken yesterday, and both ES and NQ made short term higher highs after higher lows. For my money the Santa rally is on and the question now is mainly about how far that will go.

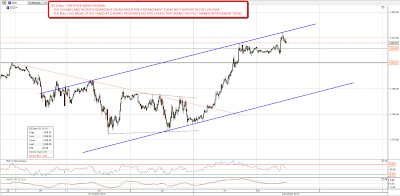
Short term I'm looking for some retracement today, though there are some very bullish patterns in play and there is a risk that ES might spike up to 1220 or higher today if they play out. On ES I have a tentative rising channel with the upper trendline hit yesterday and again at a higher level overnight. The bull pattern here is obviously the bull flag indicating to 1222+, and I wasn't happy to see that breaking up this morning. However ES has since given up those gains and the higher high was on declining RSI so I'm still thinking a retracement looks likely. NQ made a lower high overnight which was also encouraging. If ES falls back to break 1200 then I'm expecting a return to channel support in the 1188 – 90 area,which I'd be regarding as a good buying opportunity:

The other bull pattern that I've been looking at this morning is the IHS that has formed within the EURUSD declining channel. The neckline hasn't been broken on an hourly basis yet but if it is then the pattern indicates to declining resistance in the 1.34 area, and I'd expect to see that made, as IHSes formed at a channel trendline tend to be very good performers. If that happens we might well see ES testing the recent highs by the end of the week:

I haven't much to add to that in the short term, so I've some other interesting charts to share this morning. The first is my chart of the bull market since March 2009, which has been a move of simple technical beauty. The recent highs and lows on SPX fit very well within the established internal support / resistance internal trendlines and it would suggest a target for this December rally in the 1250 area, unless of course it breaks up through into the next range:

The next chart is the long term copper chart, where we are just under massive long term resistance. A weekly close above $405 would look very bullish but right here just under $400 this looks a very courageous long:

I've been watching the recent meltdown in bonds with interest and found a nice broadening descending wedge on the TLT 60min chart that looks very tradeable: