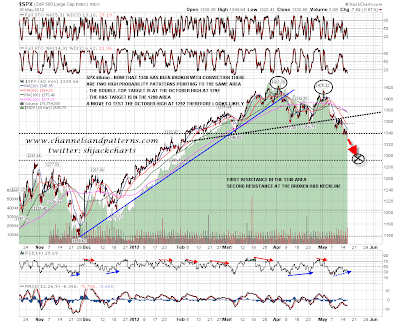
1340 SPX broke with some confidence yesterday and is no longer strong support. The double-top and H&S targets on SPX are in the 1292 area at the October high and that is the next big support level on SPX. Those are both high probability patterns and looking at a wide spectrum of charts this morning the odds that we will see that test in the next few days or weeks looks good. Everything looks oversold and we may well see some decent bounces on the way however. These bounces will look like good short entry points. Here's the SPX 60min chart:
Slope of Hope Blog Posts
Slope initially began as a blog, so this is where most of the website’s content resides. Here we have tens of thousands of posts dating back over a decade. These are listed in reverse chronological order. Click on any category icon below to see posts tagged with that particular subject, or click on a word in the category cloud on the right side of the screen for more specific choices.
Brazil – Like I Said….
A follow-up to my post of May 8th….
Possible Bounce Setup (by Springheel Jack)
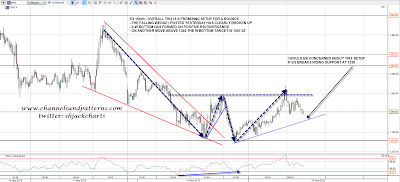
SPX made a lower low yesterday and finally tested the 1340 support level. There has been no conviction break as yet. While that remains the case, and with the proviso that I'm expecting more downside and any bounce here will therefore be counter-trend, I'm thinking we may well see a relief bounce here. On the ES 15min chart the falling wedge I posted yesterday has broken up, with the low yesterday slightly below the wedge support level that I gave yesterday morning. With the decline yesterday afternoon a promising W bottom setup has also formed. On the next move over 1345 the pattern target is 1357.25, and we may well see that today or tomorrow, though the chances of seeing that will drop significantly if ES breaks below rising support at 1338 this morning:
The Trend is Down (by Springheel Jack)
Whichever way you cut it the chart setup for equities here looks bearish. SPX still hasn't broken below 1340 support but the repeated failures at the broken H&S neckline last week look very ominous. There are in fact two bear patterns in play here. The first is the sloping H&S indicating to the 1290 area that I've been posting every day. the second is a double-top on the April and May highs, that indicates to 1292. Given that 1292 was also the October high and an important support level, on a conviction break below 1340 the obvious target has to be a test of 1292 SPX:
More Bearish Charts (by Springheel Jack)
Well I said yesterday morning that the key to the day on SPX was the 1365.74 level, and the HOD was 1365.88. A marginally higher high but nothing worth writing home about. Declining resistance was pinocchioed but held on the SPX 15min chart, and unless that can be broken today in the 1360-1 area the bulls have nothing: