



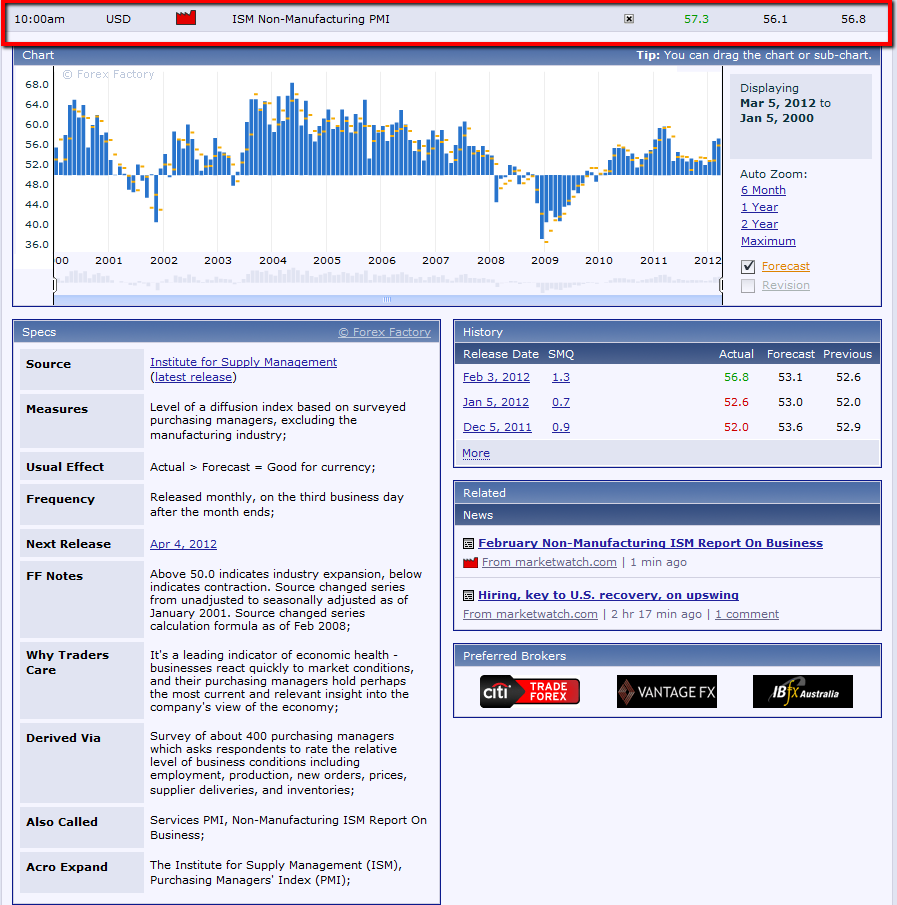
Mixed data released today shows that ISM Non-Manufacturing PMI rose, while Factory Orders declined, as shown on the graphs below…conflicting messages for a second month. Take your pick as to which one you like!
Slope initially began as a blog, so this is where most of the website’s content resides. Here we have tens of thousands of posts dating back over a decade. These are listed in reverse chronological order. Click on any category icon below to see posts tagged with that particular subject, or click on a word in the category cloud on the right side of the screen for more specific choices.
By Strawberry Blonde -
Mixed data released today shows that ISM Non-Manufacturing PMI rose, while Factory Orders declined, as shown on the graphs below…conflicting messages for a second month. Take your pick as to which one you like!
By Strawberry Blonde -
Further to my last weekly market update, here is a summary of where money flow ended for Week 1 of March, 2012.
The Weekly charts below of YM, ES, NQ & TF show that the YM, ES and NQ made a higher close than the prior week on higher volumes. The ES did not close above its 2011 high of 1373.50, but made a higher closing high. The NQ broke out of and closed above its upper channel. The TF made a lower weekly close for a second consecutive week on higher volumes…it's also the only one not to have made a higher weekly close in February since Week 1…one to watch for possible continuing weakness, particularly if it breaks and holds below its uptrending lower channel and Fibonacci extension confluence level around 796.00.
By Strawberry Blonde -
Below is a Daily chart of CAT. Price made a new all-time high on February 24th. There are negative divergences on the MACD, Stochastics, and RSI indicators, volumes are declining, and Bollinger Bands are tightening.
One to watch, in particular, as related to emerging markets and BRIC countries, which are also trading under similar constraints at major resistance levels, as outlined in my post of February 27th.
Near-term support lies around a Fibonacci, channel, moving average, and price confluence level of 105.00ish.
By Strawberry Blonde -
Data released yesterday morning shows that the unemployment rate in Europe spiked to a new 12-year high, as shown on the graph below.
Unemployment has been steadily rising, in spite of LTRO 1…we'll see if LTRO 2 makes any difference in due course…although, I very much doubt that it has any relevance or useful purpose in solving this growing problem.

By Strawberry Blonde -
Data released today shows that:
as shown on the three graphs below.


