Slope of Hope Blog Posts

Slope initially began as a blog, so this is where most of the website’s content resides. Here we have tens of thousands of posts dating back over a decade. These are listed in reverse chronological order. Click on any category icon below to see posts tagged with that particular subject, or click on a word in the category cloud on the right side of the screen for more specific choices.

Channel Surfing on the YM, ES, NQ & TF

By -

You can see on the 4-Hour charts below that, from their March high to April low, the YM, ES, NQ & TF are still trading within their Fibonacci retracement zone. All of them are below the 50% level, with YM as the strongest, followed by ES, NQ, and TF, respectively.

The YM and ES have formed an uptrending channel from the low, and price is still trading within it after Thursday's close, although the YM pierced briefly below in Thursday's trading.

The NQ and TF are still trading within a downtrending channel from high to low, although the NQ pierced briefly above in Thursday's action, and the TF is attempting to form an uptrending channel.
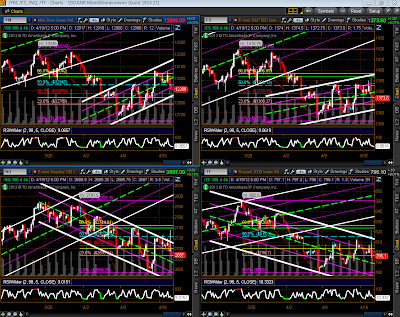
I mentioned in my post of April 17th that I'd be looking for a continuation of Tuesday's advance and a hold above its high on any retest before I would assign a "bullish" rating to all four in the short term. Since that hasn't happened, we'll have to see whether we get more choppy sideways movement, or a resumption of the pullback below the low of the Fibonacci retracement, or whether we see price stair-step upwards to break and hold above Tuesday's high, before a new trend is eventually established on a Daily timeframe. I'd re-iterate that should this third scenario play out, I'd like to see high volumes support such a move, particularly on any breakout and hold above April's high, especially with respect to the NQ (for the reasons I explained on April 17th). 

 

Show Me Evidence of Improving Economic Conditions

By -

I keep hearing talk of improving economic conditions in the U.S., but Thursday's data shows a decline in Existing Home Sales, Philly Fed Manufacturing, and the CB Leading Index, as shown on the graphs below. Add to these, Monday's data release showing a further decline in the NAHB Housing Market Index, as shown on the graph below.

Show me evidence, other than the unabated rise in the stock markets since last October, that conditions are actually improving. As I mentioned in my post of April 16th, I'll be keeping a close watch on the U.S., European, and Chinese Financials over the next weeks.

Additionally, Thursday's data release shows a decline, once again, in Europe's Consumer Confidence, as shown on the last graph.


(more…)

Very Simply…

By -

Looking at the Daily charts below of YM, ES, NQ & TF, I'd be looking for a continuation of Tuesday's advance and a hold above its high on any retest before I would assign a "bullish" rating to all four in the short term…so, very simply, I'd like to see price remain above the middle Bollinger Band on future upward price movement with the caveat that high volumes support such a move, particularly on any breakout and hold above April's highs. Otherwise, we may see further choppy sideways movement, or a deeper pullback until a new trend is established.

Inasmuch as the TF was unable to close near its high of the day, this e-mini futures index, especially, will need to attract heavier buying interest if it is going to present us with a convincing rally.

Additionally, I'm still mindful of my comments of April 13th with respect to the NQ…namely:
"The NQ's volume in the Volume Profile from February onwards is very thin, which signals a potential weakness/problem in this e-mini futures index being able to advance much further and hold above its 2011 highs. I wouldn't be surprised to see price drop back to this level at some point and further buying volumes finally enter to support a convincing rally…no doubt this would have a negative impact/drag on the other three indices."

The 4-Hour charts below show that price has rallied to the 61.8% Fibonacci retracement level on the YM, and touched the 50% level on the ES, NQ & TF. A short-term bullish scenario as I've described above would put all four on track to potentially reach their 127.2% external Fibonacci retracement targets which I described in my post of April 12th by Options Expiry Friday, April 20th. Since these are pretty lofty targets, we'd need extreme bullish advances to occur over each of the next three days…we'll see what happens.