Slope of Hope Blog Posts

Slope initially began as a blog, so this is where most of the website’s content resides. Here we have tens of thousands of posts dating back over a decade. These are listed in reverse chronological order. Click on any category icon below to see posts tagged with that particular subject, or click on a word in the category cloud on the right side of the screen for more specific choices.

The Dirt Under the Carpet

By -

With today's Fed announcement out of the way now, we see that no new Fed monetary easing programs are underway.

Instead, the U.S. is still left with this…their growing national debt. This is something that the Fed cannot solve…it's up to the politicians, and, still, I've heard nothing this year that leads me to believe that any part of this is being tackled. Instead, it seems to be the dirt that is lingering under the carpet, never to be dealt with until, perhaps, after the November election, or, perhaps, not at all.

With issues such as declining Durable Goods Orders and Core Durable Goods orders since 2001 and 2002, respectively, as shown on the graphs below (data released on Wednesday), declining consumer optimism, and housing numbers still at 2009 recessionary lows, I would have thought that politicians would have acted more responsibly to reduce the debt while finding measures to stimulate their economy. 


(more…)

Harbingers of Economic Contraction?

By -

Data released on Tuesday shows that Home Prices rose, but New Home Sales fell, as shown on the graphs below.

This data goes hand-in-hand with a decline in Existing Home Sales and in the NAHB Housing Market Index, as mentioned in my post of April 19th.

Additionally, Consumer Confidence fell, as shown on the graph below. Since it's a "leading indicator of consumer spending, which accounts for a majority of overall economic activity," it's worth tracking to see if this is a harbinger of economic contraction, or even recession.


Top-Down Analysis of SPX

By -

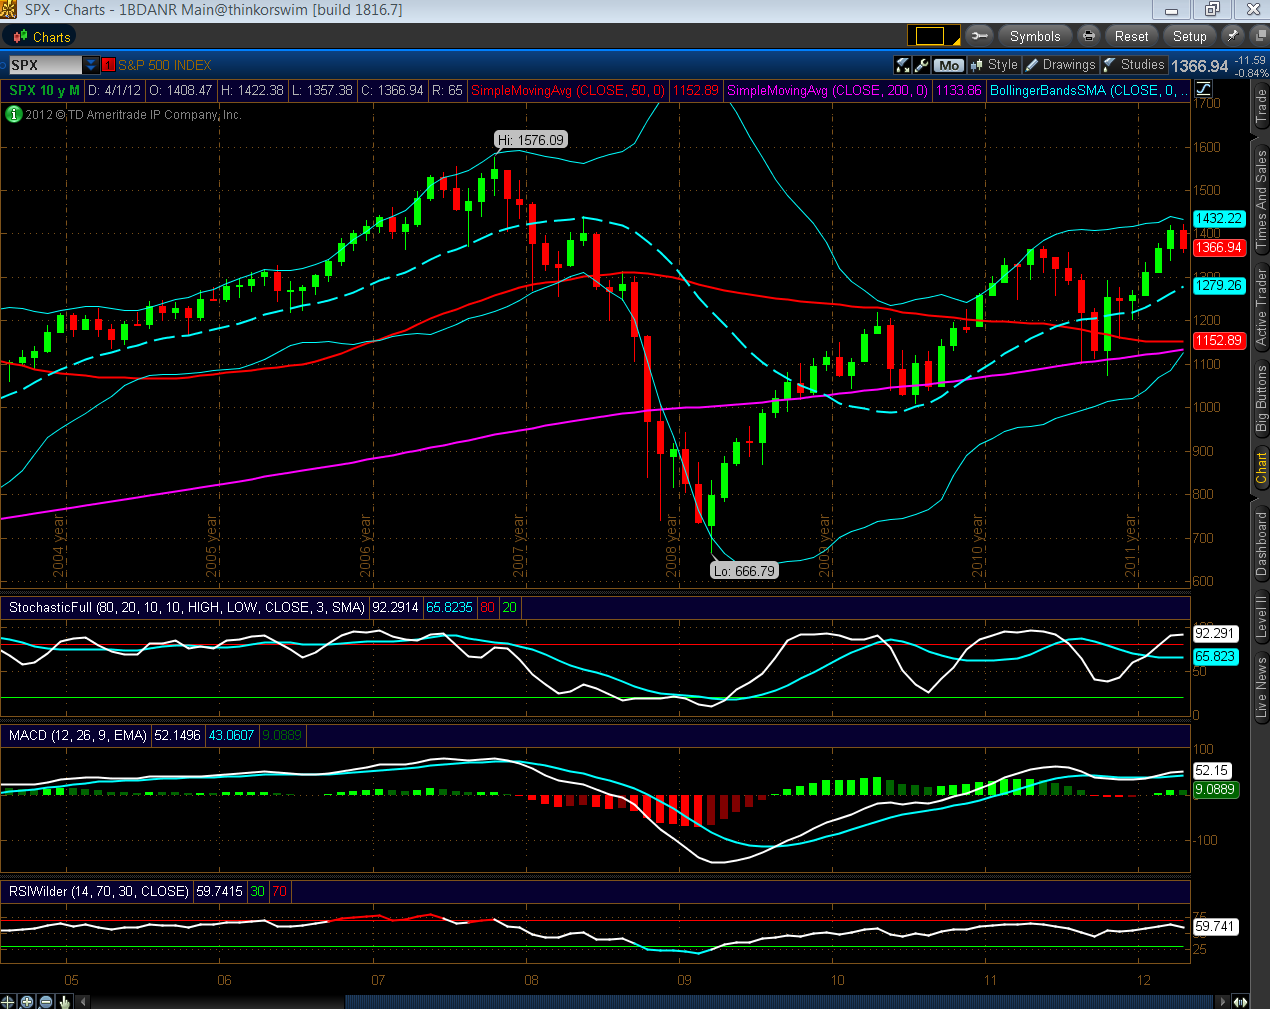
Below are Monthly, Weekly and Daily charts of the SPX. The following is my top-down analysis as of today's close.

Monthly Timeframe: Although price made a higher swing high this year over last year's high, the Stochastics, MACD, and RSI indicators did not…upside momentum is decreasing on the MACD histogram, and the RSI is hooking down. Bollinger Bands are tightening, suggesting a change in trend to the downside. Price is just below the top Bollinger Band, with the next level of support being the middle Bollinger Band at 1279. The 50 sma (red) is in danger of crossing below the 200 sma (pink) and is near the bottom Bollinger Band, forming the next major support level around 1150.

(more…)

Homebuilders ETF (XHB)…Volatility Building

By -

I'll be watching these two charts (Monthly and Daily) on XHB in relation to New Home Sales data to be released on Tuesday (sales are still near 2009 lows, as shown on the graph below).

Immediate resistance is just above at a confluence of a 61.8% Fibonacci fanline, 50 dma, Monthly Volume Profile POC, Monthly VWAP, and the lower 1/3 level from the 2006 high to the 2009 low…price needs to clear and hold above 21.00 for a potential rally…otherwise, I'd look for more downside movement…looks like lots of volatility building here.


(more…)