Slope of Hope Blog Posts

Slope initially began as a blog, so this is where most of the website’s content resides. Here we have tens of thousands of posts dating back over a decade. These are listed in reverse chronological order. Click on any category icon below to see posts tagged with that particular subject, or click on a word in the category cloud on the right side of the screen for more specific choices.

Hedging Update — High Vol Edition

By -

Higher vol, higher hedging costs

The Chicago Board Options Exchange Market Volatility Index (VIX) declined 6.77%, to 36.36 on Friday. To illustrate how this level of volatilty affects hedging costs, I've included the two tables below — one showing the hedging costs of a basket of ADRs and ETFs on Friday, August 12, and another showing the hedging costs of the same basket on August 2nd, with the VIX under 25. Before that, though, a quick note of thanks to Tim and my fellow Slopers.

(more…)

Here Comes Another Lesson

By -

Here comes another lesson

The market crash Monday, coming hot on the heels of the one last Thursday, made me think of the book of dark short stories pictured below (one I think some other Slopers might appreciate), Here Comes Another Lesson. A brief excerpt should illustrate.

This excerpt is from a story called "The Professor of Atheism: Here Comes Another Lesson", in which a failed academic named Charles finds a pair of angel wings that miraculously attach to his body and allow him to fly:

“Hey, Professor!” Charles turns around to see a very short, very wide man stamping and scraping his feet on the cinders. His blunt, wide head is lowered between his mountainous shoulders, and a massive nose ring loops between his snorting nostrils. “Who are you?” asks Charles. “I’m a real angel,” says the main. “Then where are your wings?” “Don’t be stupid! That’s just a cliché.” Even before these words are out of his mouth, the man has begun running toward Charles, ramming his blunt forehead into Charles’s solar plexus and knocking him onto his bewinged back. It is a moment before Charles can catch his breath. He sits up and asks, “What did you do that for?”. “To teach you a lesson”. “What kind of lesson is that?” What other kind of lesson is there?” It is a long time before Charles can think of a response to this one. Finally he asks, “Who sent you?” Who do you think?” “God?” The man laughs. “Satan?” the man laughs even harder. “You know,” he says, “your so pathetic I almost hate to do this.” The man slaps his hands together and begins stamping and shuffling again. “Okay,” he says, “here comes another lesson!”

Three lessons from the market meltdowns

Lesson 1: Diversification Doesn't Protect Against Market Risk

Diversifying among a basket of different stocks reduces stock-specific risk, but not market risk. When the market crashes, nearly all stocks get hammered. That’s what happened on Thursday, as 497 of the stocks in the S&P 500 were down on the day. And that's what happened Monday, when all 500 stocks in the S&P 500 were down on the day.

Lesson 2: Hedging Can Limit Market Risk

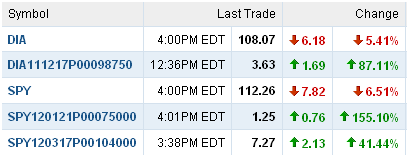
The screen shot below shows the performance of the SPDR S&P 500 Trust ETF (SPY), the SPDR Dow Jones Industrial Average ETF (DIA), and a few put options on them that I referred to in my last Slope post. More on the DIA puts below.

Up 87.11% Monday

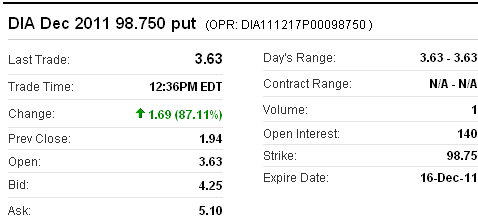
This is the $98.75 strike put option on DIA expiring in December, 2011. In recent posts, I've mentioned in the disclosures that I am long puts on DIA as a hedge. Those are the specific DIA puts I own. In late June, I used Portfolio Armor to find the optimal put options to hedge against a greater-than-20% drop in DIA, and those were the ones Portfolio Armor presented. I bought them at $1.28. The screen shot below shows the quote for them as of Thursday, but first a quick reminder about optimal puts.

About Optimal Puts

Optimal puts are the ones that will give you the level of protection you specify at the lowest possible cost. As University of Maine finance professor Dr. Robert Strong, CFA has noted, picking the most economical puts can be a complicated task. With Portfolio Armor (available on the web and as an Apple iOS app), you just enter the symbol of the stock or ETF you're looking to hedge, the number of shares you own, and the maximum decline you're willing to risk (your threshold). Then the app uses an algorithm developed by a finance PhD to sort through and analyze all of the available puts for your position, scanning for the optimal ones.

Lesson 3: Higher Volatility Means Higher Hedging Costs

A point I've made in previous posts (e.g., this one) is that investors ought to consider hedging when volatility is low, and hedging costs are relatively low as well. Below are a few snap shots of hedging costs at different volatility levels that show how quickly volatility can spike and hedging costs can rise.

Hedging costs as of May 9, with the VIX at 17.16

The hedging costs in this table were first posted in this article on May 10.

Symbol

Name

Cost of Protection (as % of position value)

SPY

SPDR S&P 500

1.77%*

DIA SPDR Dow Jones Industrial Avg 1.49%*
QQQ PowerShares QQQ Trust 2.11%*

Hedging costs as of August 5, with the VIX at 32

Symbol

Name

Cost of Protection (as % of position value)

SPY

SPDR S&P 500

3.56%**

DIA SPDR Dow Jones Industrial Avg 3.06%**
QQQ PowerShares QQQ Trust 3.30%**

Hedging costs as of August 8, with the VIX at 48

Symbol

Name

Cost of Protection (as % of position value)

SPY

SPDR S&P 500

5.38%**

DIA SPDR Dow Jones Industrial Avg 5.23%**
QQQ PowerShares QQQ Trust 5.83%*

*Based on optimal puts expiring in December 2011.

**Based on optimal puts expiring in March 2012.

Hedging Update — Post Plunge Edition

By -

Hedging costs after Thursday's market meltdown

Last week, with the debt ceiling negotiations dragging on, we looked at the costs of hedging a handful of equity index, gold-, Treasury bond-, and dollar index-tracking ETFs. Below is a snap shot showing the current hedging costs of the same basket of ETFs after Thursday's market meltdown. Before that though, a look at how a couple sets of index ETF puts fared during Thursday's market meltdown.

SPY puts

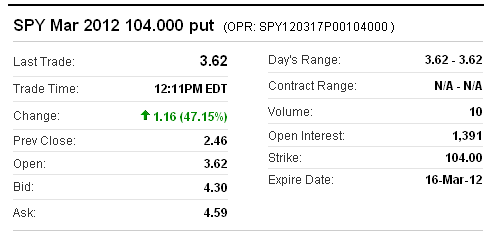
For a Seeking Alpha post Wednesday, I used Portfolio Armor to pull up the optimal puts to hedge against a greater-than-20% drop in SPY over the next several months.  Usually, I don't keep track of what the optimal puts are for these articles, I just post the costs.  As it happened though, someone asked me what they were, so I made a note of them. They were the $104 strike, March 2012 puts. Here's what happened to them Thursday.


DIA puts

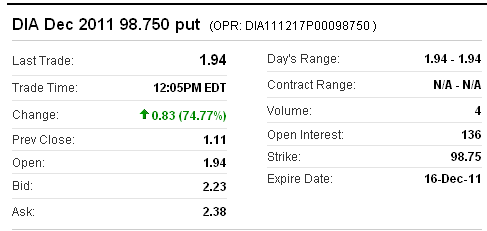
These puts I kept track of because I own them. In late June, I used Portfolio Armor to find the optimal put options to hedge against a greater-than-20% drop in DIA, which turned out to be the $98.75 strike, December puts. Here's what happened to those puts Thursday.

Current hedging costs: an update on last week's table

Hedging against a >30% correction in stocks

The table below shows the costs, as of Thursday's close, of hedging the same 5 equity index ETFs against greater-than-30% corrections over the next several months, using optimal puts.

Current Hedging against a >15% correction in bonds, gold, and the dollar

The table also shows the costs of hedging the same gold-, U.S. dollar-, and Treasury Bond-tracking ETFs against greater-than-15% declines over the next several months using optimal puts. First, a quick reminder about what optimal puts are, and a note about costs.

Optimal puts

Optimal puts are the ones that will give you the level of protection you want at the lowest possible cost. As University of Maine finance professor Dr. Robert Strong, CFA has noted, picking the most economical puts can be a complicated task.

With Portfolio Armor (available on the web, and as an Apple iOS app), you just enter the symbol of the stock or ETF you're looking to hedge, the number of shares you own, and the maximum decline you're willing to risk (your threshold – you can enter any percentage you like, but the larger the percentage, the greater the chance there will be optimal puts available for the position). Then the app uses an algorithm developed by a finance Ph.D. to sort through and analyze all of the available puts for your position, scanning for the optimal ones. 

A note about costs

To be conservative, Portfolio Armor calculates hedging costs using the ask price of the optimal puts. In many cases, you may be able to buy the puts for a lower cost (between the bid and the ask prices).

Hedging Costs as of Thursday's Close

Symbol

Name

Cost of Protecting against >30% Decline, as % of position


Equity Index ETFs


QQQ

PowerShares QQQ Trust

1.50%*

SPY

SPDR S&P 500

1.78%*

DIA

SPDR Dow Jones Industrial Avg

1.61%*

EFA iShares MSCI EAFE Index 2.65%*
EEM iShares MSCI Emerging Markets 2.80%*
     
Symbol Name Cost of Protecting against a >15% Decline, as % of position
     
  U.S Dollar ETF  
UUP PowerShares DB US Dollar Index 0.51%*
  U.S. Treasury Bonds  
TLT iShares Barclays 20+ Yr Treas 1.97%*
 

Gold


GLD

SPDR Gold Trust

1.77%

*Based on optimal puts expiring in March, 2012.

Tigger Time

By -


0803-tigger The wonderful thing about tiggers

Is tiggers are wonderful things!

Their tops are made out of rubber;

Their bottoms are made out of springs!

They're bouncy, trouncy, flouncy, pouncy,Fun! Fun! Fun! Fun! Fun!

But the most wonderful thing about tiggers is

I'm the only one!


There isn't a person on the planet better at beating me up about trading than me. Today, however, I'd like to give myself a hearty pat on the back. This is one of those few days that I'm really pleased at how I handled myself.

I came into this day with 84 short positions and no longs (I sold my SPY before the opening bell at a profit). And I ended the day – a day in which all the major indexes were higher! – with a profit. It wasn't a huge profit, but for me to have that many shorts at the day's beginning and end the day with a profit is something about which I'm quite pleased. (I did a fair bit of successful day-trading on the long side).

So, I'm happy with myself, big deal. What's to be learned? Well, it all comes down to anticipating moves and executing based on that plan. In my case, although I thought there was a risk the market would pop higher (hence the SPY hedge), I thought there was still potential for more weakness before a real bounce happened. I swiftly moved through all my positions and took profits on most of them. As I sit here typing this, I still have 29 shorts that, in my opinion, continue to offer good risk/reward. They are balanced by one very large SPY position. So I'm presently half in cash with a 33/67 split of long/short in my actual positions.

But here's the most important point I have to make: I look at over 1,000 charts every single day (yes, I'm quick). And I cannot remember any instance in my life when I've seen a greater abundance of short setups. These setups are far too risky at these heavily depressed levels. But – oh, my God in heaven – given an adequate bounce, it is entirely possible that I will position myself with literally 200 different securities that, collectively, offer a tantalizing opportunity for a serious fall.

So how long do we have to wait? I dunno. It took 30 trading days from the March bottom to the May peak before we flipped down again. The next ascent higher from bottom to top took a mere ten days. Maybe this next lift will take just a week – I honestly don't know. The price level is what counts, not the day of the week.

I don't want to have to trust my judgment on when an index may or may not have peaked. I will more than likely be wrong (as will you, bucky). I am comfortable, however, looking at all the stocks in my Bear Pen each day and, as they are individually at levels that represent a prudent entry point, I shall enter them one by one.

What's the risk in being so "light" right now? Well, for a bear like me, the risk is that the bottom will fall out, and I won't be fully participating. Believe me, that's a nearly omnipresent dread of mine. But to heavily short a market simply based on the prospect that there's a chance it might fall the next day is, to me, illogical. I take the market on a chart-by-chart basis, and I spread my positions thin.

So I must exercise a virtue which, for my personality, is absolutely puny – and that is patience. I say to you again that I think the most fantastic bull trap in years might be forming over the coming days or weeks. What will the catalyst be? Maybe all the rah-rah surrounding the prospect of that jackoff Bernanke introducing QE3 at Jackson HOLE late this month.

The most delicious irony, of course, would be if a rally into his HOLE speech delivered to us bears the aforementioned bull trap. We shall see. But the reason hardly matters. I simply believe that, although it may take a little longer than I'd like, our deliverance may soon be at hand.


0803-pinheads

Hedging Against a Dollar Drop

By -

Chafing at the world's reserve currency

After the excitement of the U.S. debt ceiling negotiations going down to the wire, Russian Prime Minister Vladimir Putin offered these comments about the U.S. and its dollar:

They are living like parasites off the global economy and their monopoly of the dollar.

[…]

If over there (in America) there is a systemic malfunction, this will affect everyone," Putin told the young Russians. "Countries like Russia and China hold a significant part of their reserves in American securities … There should be other reserve currencies.

With Putin's sentiments in mind, let's look at a way to hedge against a further drop in the dollar

Hedging the dollar

The steps below show how to hedge the dollar by buying optimal puts on the PowerShares DB USD Index (UUP) as a proxy for it. First a quick reminder about what optimal puts mean in this context.

About optimal puts

Optimal puts are the ones that will give you the level of protection you want at the lowest possible cost. As University of Maine finance professor Dr. Robert Strong, CFA has noted, picking the most economical puts can be a complicated task. With Portfolio Armor (available on the web and as an Apple iOS app), you just enter the symbol of the stock or ETF you're looking to hedge, the number of shares you own, and the maximum decline you're willing to risk (your threshold). Then the app uses an algorithm developed by a finance Ph.D to sort through and analyze all of the available puts for your position, scanning for the optimal ones.

A step by step example

Step 1: Enter a ticker symbol

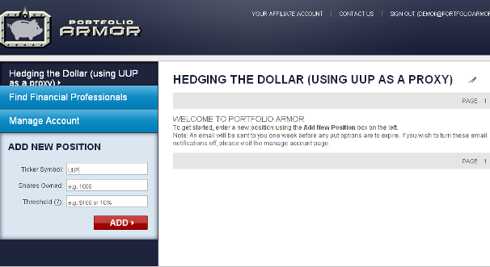
In this case, we're using UUP as a proxy for the dollar we've entered UUP in the Ticker Symbol field below.

Step 2: Enter a number of shares

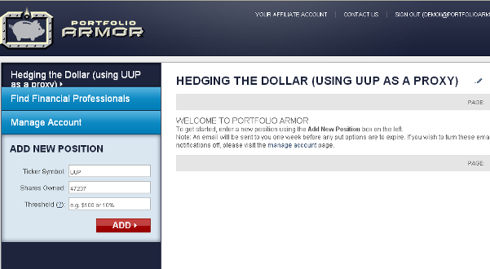
For the purposes of this example, let's assume an investor has a $1 million portfolio, all in dollar-denominated assets.  So, since we're using UUP as a proxy, the number of shares we'll enter will be $1,000,000 / the most recent share price of UUP ($21.17, as of after hours Monday) = 47,236.7. We've rounded that up to 47,237 and entered that number in the "Shares Owned" field in the screen cap below.

Step 3: Enter a decline threshold

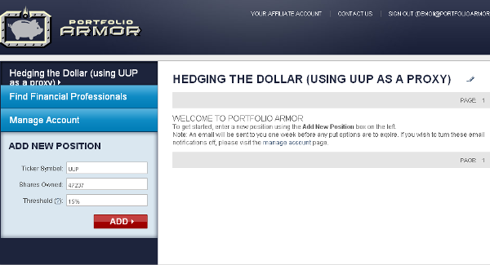
You can enter any percentage you like for a threshold when using Portfolio Armor (the higher the percentage though, the greater the chance you will find optimal puts for your position). I've entered 15% in the "Threshold" field below.

Step 4: Click the red button

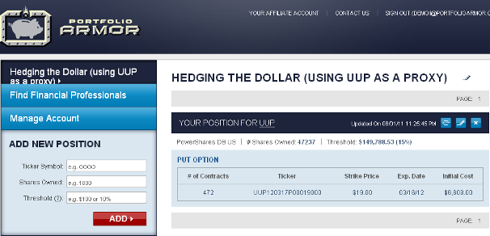
A moment after clicking the red button, you'd see the screen cap below, which shows the optimal put option contracts to buy to hedge against a >15% drop in UUP between now and March 16, 2012. The cost of this protection on a $1 million position would be $6,608, or about 0.66% of the position value.1, 2

1Note that, in this case, Portfolio Armor rounded down the number of shares of UUP we entered to the nearest hundred (since one put option contract represents the right to sell one hundred shares of the underlying security), and then presented us with 472 of the put option contracts that would slightly over-hedge the 47,200 shares of UUP they cover, so that the total value of our 47,237 shares of UUP would be protected against a greater-than-15% decline.

2To be conservative, Portfolio Armor quoted that cost based on the ask price of the optimal puts. In practice, an investor can often purchase puts for a lower price, i.e., some price between the bid and the ask.