SPX tested the lower bollinger band yesterday, and if this has just been a retracement, that is the obvious bounce level:

On ES descending triangle support was tested yesterday and there was a strong bounce from there. Triangle support is at 1395 and on an hourly close below the triangle target is at 1374 with rising channel support in the 1375.5 area. Triangle resistance is at 1309.5 and on an hourly close above the triangle target is in the 1432.5 area, slightly below major SPX pivot resistance in the 1440 area. These triangles break down 64% of the time of course, but have a much higher probability of making target on an upward breakout:

A 64% bearish pattern has a 36% chance of breaking up of course, and as it happens there is a very good example of one of these descending triangles breaking up recently. That triangle is on gold of course, and the target is in the 2050 area, comfortably above the current high at 1923.70. Gold has broken up from the triangle, retested the break and then made new short term highs. On Bulkowski’s stats gold now has an 84% chance of reaching the 2050 area:

There wasn’t a triangle on silver, but there was a perfect test there of rising support from the 2008 low, and then a break of the declining channel from the high, retest of broken channel resistance and further move up. As with gold this looks like a solid breakout and confirmation of a major trend reversal:

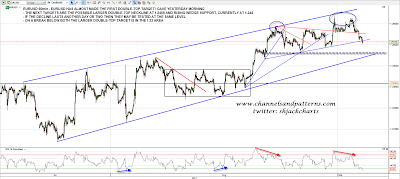
Looking at EURUSD, the first double-top target that I gave yesterday morning was almost made overnight. The next obvious support levels are the larger double-top neckline or valley low at 1.2465 and rising wedge support at 1.244. If EURUSD consolidates at the current level those two support levels could be tested near the same level in a day or two. On a break below both the larger double-top target is in the 1.23 area. I am expecting a test of rising wedge support in this retracement:
On CL there was a strong decline yesterday that re-broke the rising wedge support trendline. Overnight that held as resistance which looks bearish. There is some positive RSI divergence that makes me think that broken rising wedge support trendline may be tested again. On a break below 93.9 a double-top will trigger with a target in the 89.5 area. This topping setup could also be read as a sloping H&S with a target in the same area:

Overall I’m leaning bearish here. Descending triangles are a bear pattern, EURUSD looks weak, CL looks very weak and TLT is looking very strong. On the other hand we have not seen the test of the 1440 SPX pivot that I was expecting and some decent support has been tested repeatedly and held so far. The bulls aren’t out of the game yet, and you can see from the chart below that FTSE hit rising support from the June low at the low yesterday:

Good arguments for a break either way from here. We’ll have to see which way the triangle breaks. Until then 1409 looks a decent risk/reward short entry and 1395.5 a decent long entry as long as triangle resistance has been tested first. The next obvious move within the triangle is to triangle resistance at 1409.5 and a test of triangle support before that happened would have a higher probability of seeing that support break.




