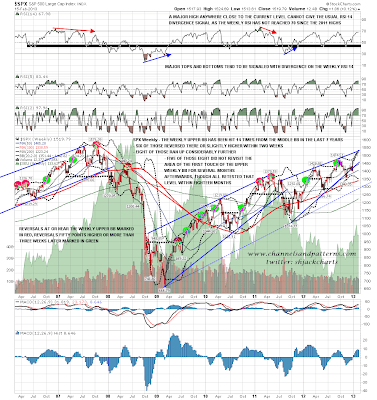
Just as I was becoming concerned that SPX would rise enough to unravel the very nice looking interim top setup on the daily RSI, we have finally seen the initial decline that should mark the start of the decline from that interim top. SPX closed on the daily middle bollinger band and it's just possible that the decline is now complete, but the odds favor more downside and I'll be talking about downside targets today, putting off my look at the resistance levels at the 2000 and 2007 SPX highs for a few days. Here is the SPX daily chart below showing the hit of the middle bollinger band with lower bollinger band support now in the 1490 area:
Slope of Hope Blog Posts
Slope initially began as a blog, so this is where most of the website’s content resides. Here we have tens of thousands of posts dating back over a decade. These are listed in reverse chronological order. Click on any category icon below to see posts tagged with that particular subject, or click on a word in the category cloud on the right side of the screen for more specific choices.
Copper Doesn’t Exactly Suggest Bull Market Ahead
Looking at Europe (by Springheel Jack)
SPX traded sideways yesterday and is close to testing the recent highs in the pre-market. This isn't encouraging for the chances that the candidate double-top on ES and SPX will play out today, but it's worth noting that the daily upper bollinger band is now at 1528, so there is some decent resistance close above the recent highs:
Silver Tests Primary Support (by Springheel Jack)
SPX went nowhere on Friday, closing the week some 15 points below the weekly upper bollinger band. This doesn't mean much in terms of retracement, but as this band is still rising at 10 or so points per week, if SPX continues to hug the upper band then that gives potential upside of 25 points from Friday's close into strong resistance. That's well worth bearing in mind:
Reining In The Risk Of A Triple-Leveraged ETF
The Downside Of Leveraged ETFs
Leveraged ETFs can add some excitement to a
portfolio: bet right on underlying index, and you can earn double or
triple the returns of that index. The downside of leveraged ETFs,
though, is their potential downside. Consider one of the most
widely-traded leveraged ETFs, the Direxion Daily Gold Miners Bull 3X
Shares (NUGT): we're just about six weeks into 2013, and unhedged NUGT
longs who bought the ETF at the beginning of the year are already down
more than 29%, as of Tuesday's close (unhedged longs, that is, who didn't use stops. A quick search of Social Trade shows that the last Sloper who wrote about buying NUGT prudently used a stop order).
Too Expensive To Hedge Against A >20% Drop With Optimal Puts
As
we noted in a recent post, hedging a security against a
greater-than-20%
drop can offer a reasonable compromise between limiting downside risk
and lowering the cost of hedging. Unsurprisingly for such a volatile ETF
(as of Tuesday, the 52-week high
and low prices on NUGT were $26.69 and $7.62, respectively), its
puts are expensive. On Tuesday, NUGT was too expensive to hedge against
a greater-than-20% drop using optimal puts*. That's because the cost of
hedging it against a greater-than-20% drop over the next several months
was itself greater than 20% of position value.