Slope of Hope Blog Posts

Slope initially began as a blog, so this is where most of the website’s content resides. Here we have tens of thousands of posts dating back over a decade. These are listed in reverse chronological order. Click on any category icon below to see posts tagged with that particular subject, or click on a word in the category cloud on the right side of the screen for more specific choices.

Gold Update…Santa Rally or Bust?

By -

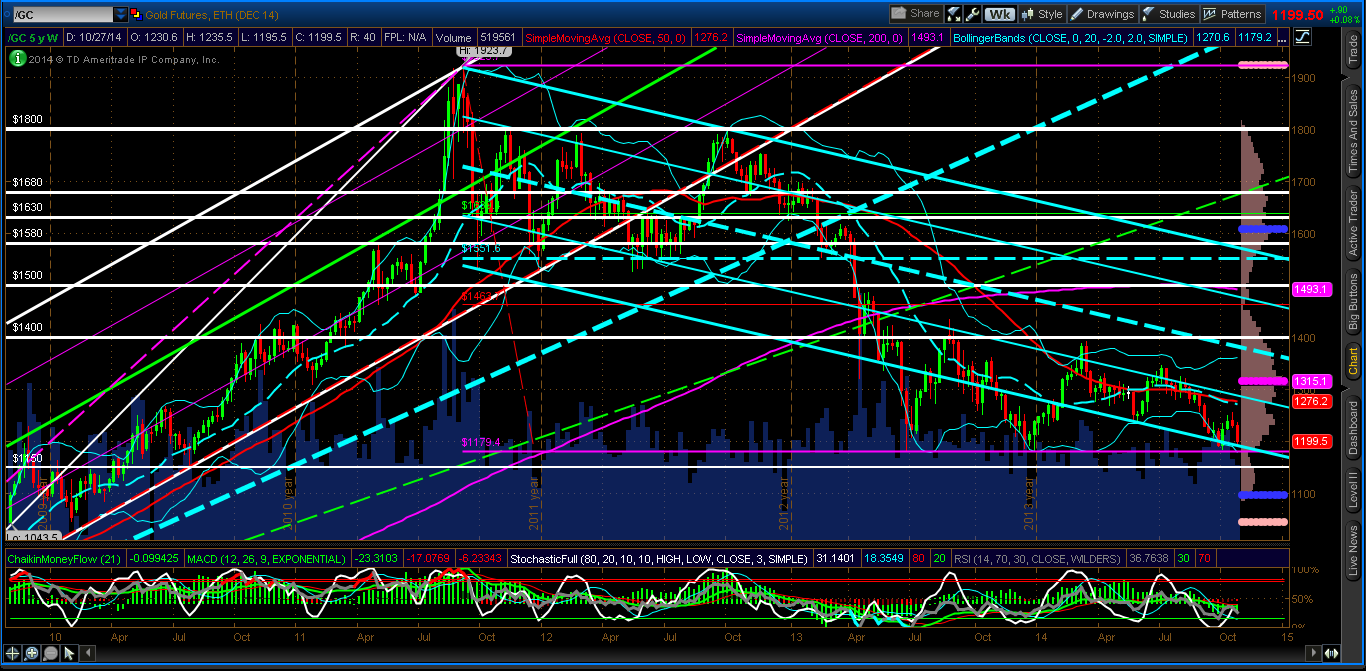
I last wrote about gold in my post of October 9th.

Price is slipping back to its critical triple-bottom support level of 1180, as shown on the 5-Year Weekly chart below. I’m watching for a break and hold below that level for a possible re-test of the 1000 level as I mentioned in that post…particularly if the SPX:VIX ratio breaks and holds above the 150.00 level, as I mentioned in my post of October 24th.
(more…)

USD Dollar and FOMC Today

By -

SPX broke strong resistance levels at the 50 DMA and the 1976-8 level yesterday to close at a very impressive 1985. That break up over the 50 DMA opens up the daily upper band as a target and that closed yesterday at 2003. With FOMC today it seems unlikely that Yellen can say a great deal to cheer the markets, QE3 has ended and is unlikely to be even temporarily revived, and the Fed has made so many soothing noises about future interest rate rises already that it’s hard to see what they could add to that. Nonetheless some more soothing noises today might just get SPX to that target at the upper band. SPX daily chart:

141029 SPX Daily Trendlines BBs MAs

(more…)

Triple-Bottom Bounce on Gold After Re-test of Critical Support Level

By -

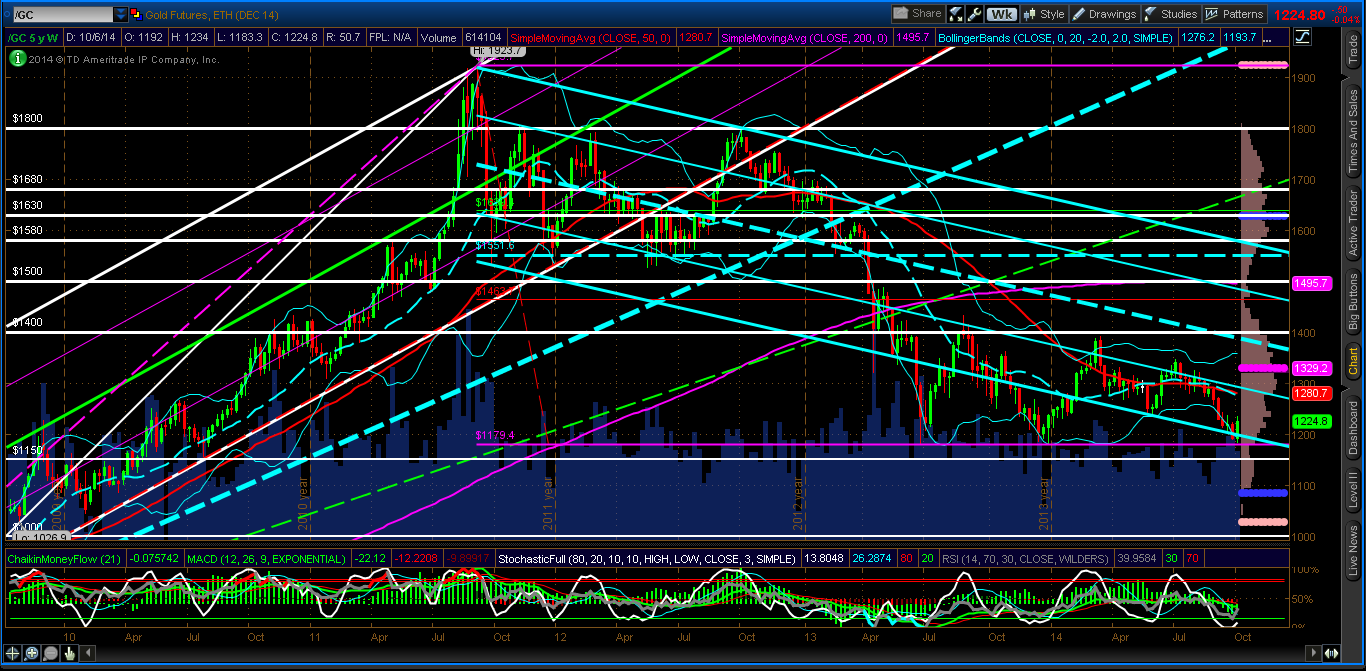
As shown on the 5-Year Weekly chart of GOLD below, price has bounced this week [as of today (Thursday)] at a triple-bottom major support level of 1180, which began in June of 2013.

This critical support level converges with the bottom of the weekly Bollinger Band, along with the lower edge of a large declining channel (which began after the all-time high of 1923.70 was made during the week of September 5th, 2011).

Failure to hold above the critical 1180 support level could see a much larger decline ahead, possibly to the 1000 level, as shown on the next 20-Year Weekly chart. Bulls will need to re-take 1300 and hold that level before we likely see any further serious commitment to, ultimately, reverse this long-standing downtrend on the weekly timeframe. (more…)