

Slope of Hope Blog Posts

Slope initially began as a blog, so this is where most of the website’s content resides. Here we have tens of thousands of posts dating back over a decade. These are listed in reverse chronological order. Click on any category icon below to see posts tagged with that particular subject, or click on a word in the category cloud on the right side of the screen for more specific choices.

Four Beautiful Topping Patterns

By -

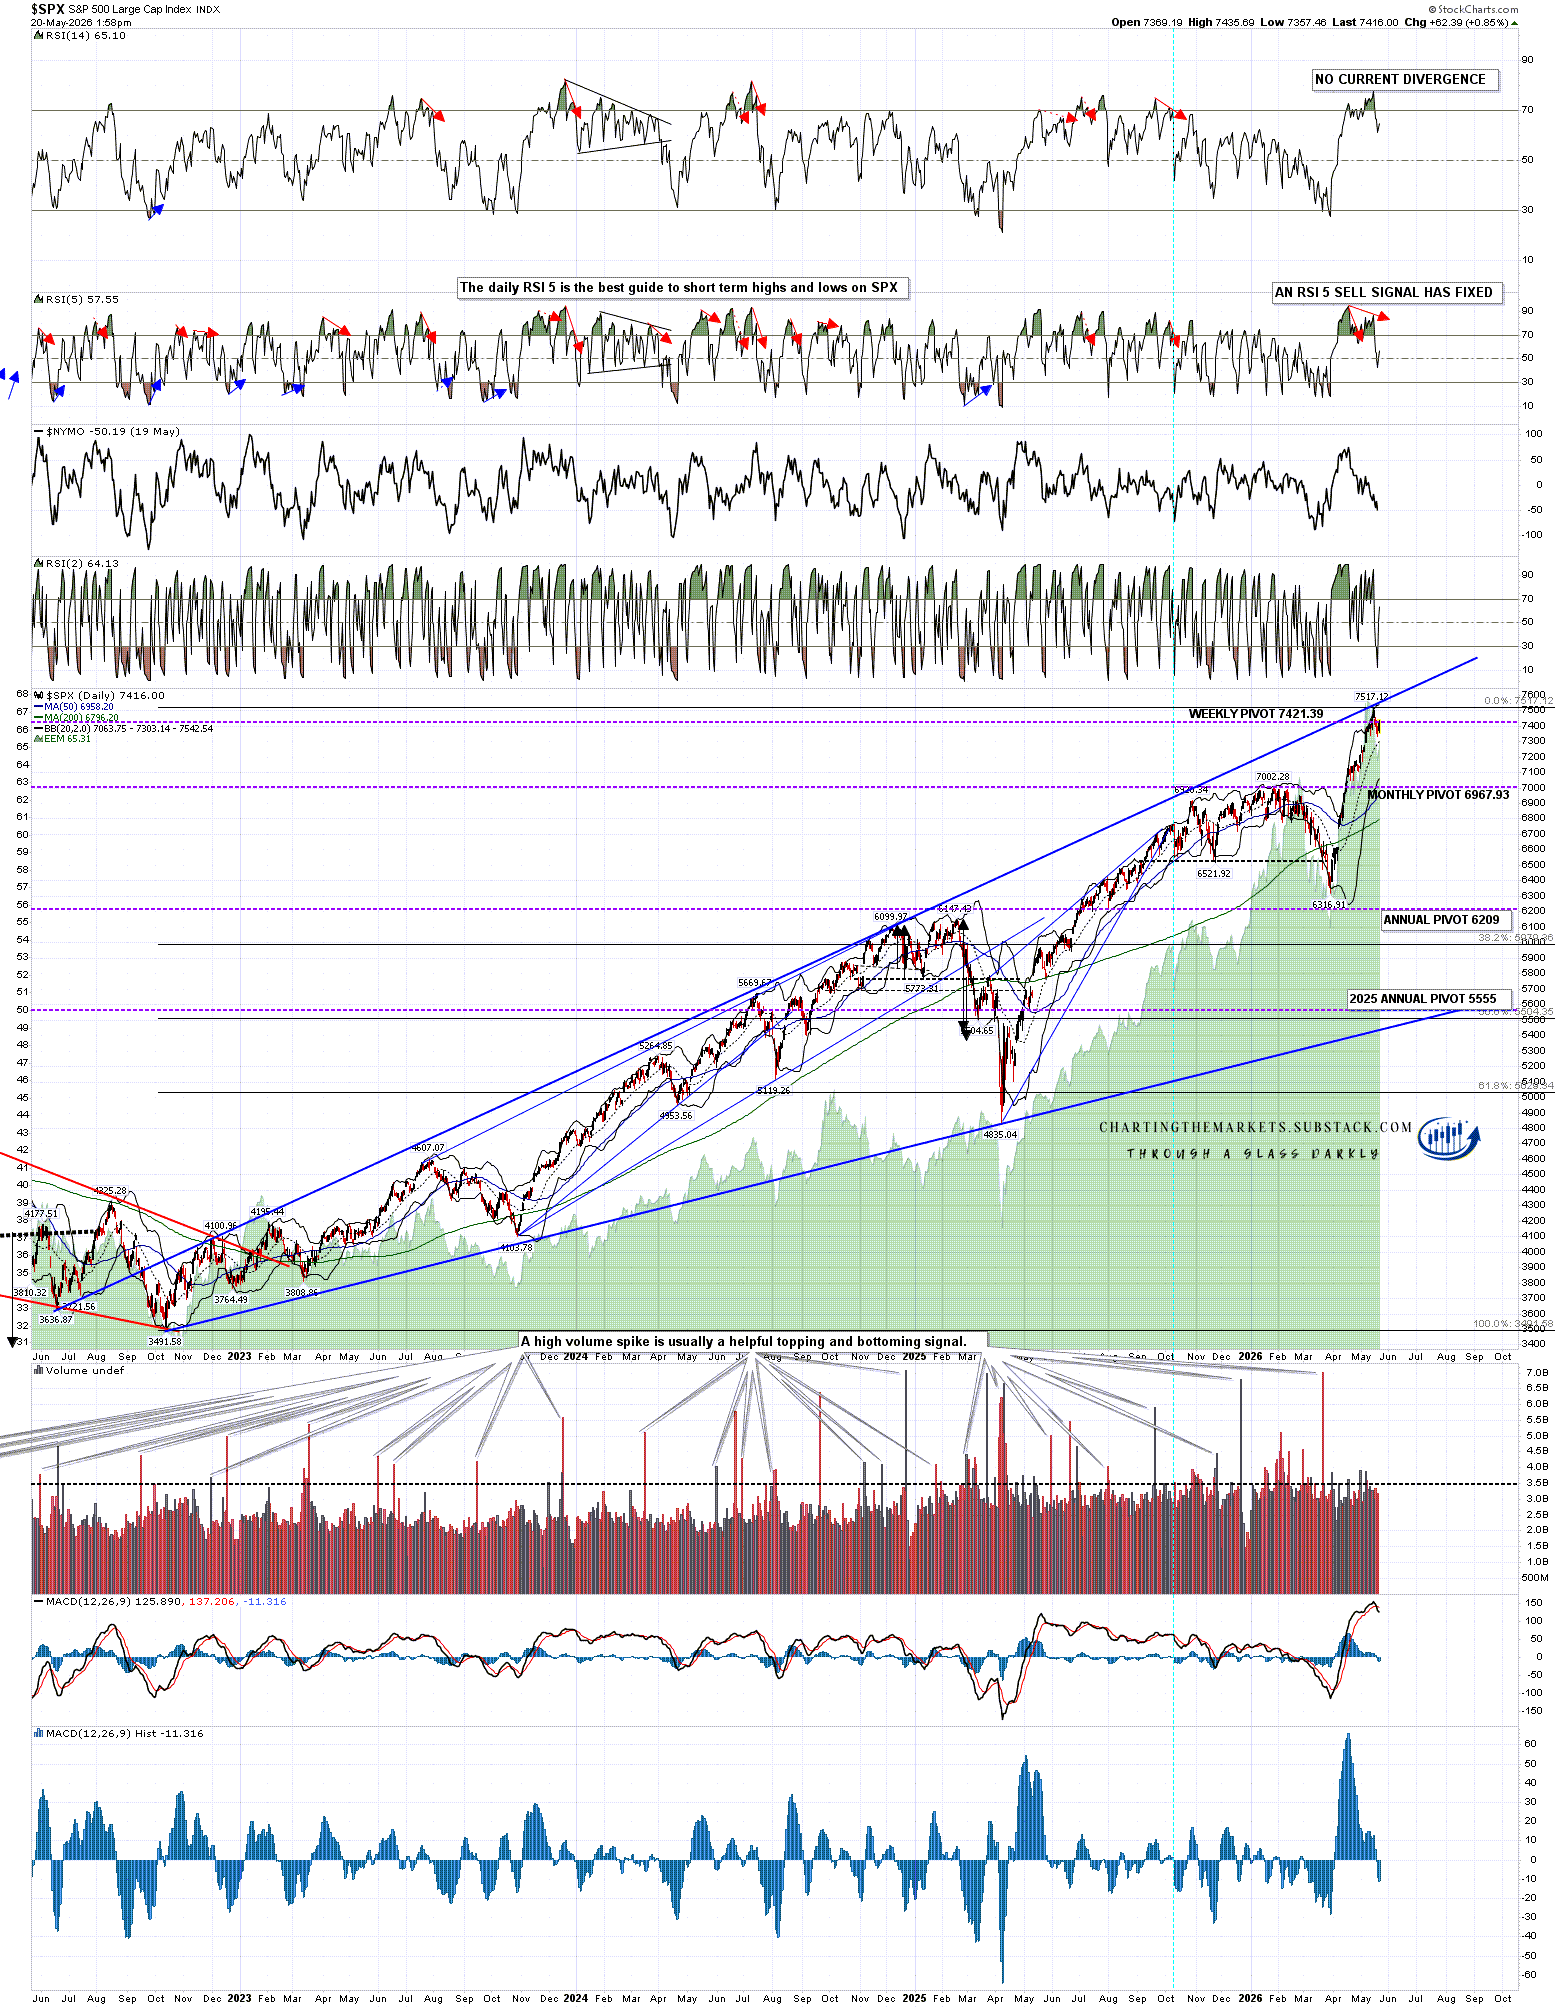
In my post on 6th May I was looking at the resistance trendline on the SPX weekly chart and that rising trendline was being close to being hit in the 7385 to 7400 area. It was then hit and exceeded in what might have been a bearish overthrow, but I had by then also drawn in an alternate high quality resistance trendline that was hit perfectly at the high on Friday. SPX could go a bit higher, but the ideal upside trendline target has been hit. Look at the chart below and admire this beautiful rising megaphone from the 2022 low. 🙂

SPX daily chart:
(more…)

Wild Thing

By -

In my post on 28th April I was talking about the Hormuz crisis but noting that when SPX made a new all time high on 19th February 2020, well after it was so obvious that COVID-19 was going to be a big problem that panic hoarders had caused a worldwide shortage of toilet paper, it reached a major resistance trendline and I was speculating that we might see that again here, giving a trendline target 200 handles higher in the 7360 area.

In my last post on 6th May I was looking at the resistance trendline again on the SPX weekly chart and that rising trendline was being close to being hit in the 7385 to 7400 area. It has since been hit and exceeded in what might be a bearish overthrow, but a have also since drawn in an alternate high-quality resistance trendline that is being hit today. SPX could go a bit higher, but the obvious upside trendline targets have now been hit.

(more…)

Toolbox of Hammers

By -

I am stuck by this consistency among the indexes: Tuesday was a hammer candlestick in every case (or a hanging man, if you prefer). The reason? It’s anyone’s guess, but my theory is that traders know the market is historically overvalued and it SHOULD go lower (hence the weakness midday) but they reflexively bid prices up based on any sniff of weakness. Still, this is the first decent selling we’ve seen since March 30th, and I wouldn’t be surprised to find out something bigger has just started.

(more…)