

Slope of Hope Blog Posts

Slope initially began as a blog, so this is where most of the website’s content resides. Here we have tens of thousands of posts dating back over a decade. These are listed in reverse chronological order. Click on any category icon below to see posts tagged with that particular subject, or click on a word in the category cloud on the right side of the screen for more specific choices.

Descending Triangle (by Springheel Jack)

By -

SPX tested the lower bollinger band yesterday, and if this has just been a retracement, that is the obvious bounce level:

On ES descending triangle support was tested yesterday and there was a strong bounce from there. Triangle support is at 1395 and on an hourly close below the triangle target is at 1374 with rising channel support in the 1375.5 area. Triangle resistance is at 1309.5 and on an hourly close above the triangle target is in the 1432.5 area, slightly below major SPX pivot resistance in the 1440 area. These triangles break down 64% of the time of course, but have a much higher probability of making target on an upward breakout:

A 64% bearish pattern has a 36% chance of breaking up of course, and as it happens there is a very good example of one of these descending triangles breaking up recently. That triangle is on gold of course, and the target is in the 2050 area, comfortably above the current high at 1923.70. Gold has broken up from the triangle, retested the break and then made new short term highs. On Bulkowski’s stats gold now has an 84% chance of reaching the 2050 area:

There wasn’t a triangle on silver, but there was a perfect test there of rising support from the 2008 low, and then a break of the declining channel from the high, retest of broken channel resistance and further move up. As with gold this looks like a solid breakout and confirmation of a major trend reversal:

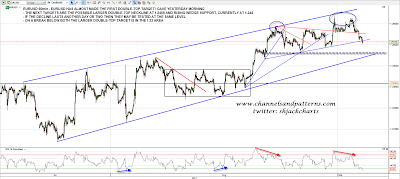
Looking at EURUSD, the first double-top target that I gave yesterday morning was almost made overnight. The next obvious support levels are the larger double-top neckline or valley low at 1.2465 and rising wedge support at 1.244. If EURUSD consolidates at the current level those two support levels could be tested near the same level in a day or two. On a break below both the larger double-top target is in the 1.23 area. I am expecting a test of rising wedge support in this retracement:
On CL there was a strong decline yesterday that re-broke the rising wedge support trendline. Overnight that held as resistance which looks bearish. There is some positive RSI divergence that makes me think that broken rising wedge support trendline may be tested again. On a break below 93.9 a double-top will trigger with a target in the 89.5 area. This topping setup could also be read as a sloping H&S with a target in the same area:

Overall I’m leaning bearish here. Descending triangles are a bear pattern, EURUSD looks weak, CL looks very weak and TLT is looking very strong. On the other hand we have not seen the test of the 1440 SPX pivot that I was expecting and some decent support has been tested repeatedly and held so far. The bulls aren’t out of the game yet, and you can see from the chart below that FTSE hit rising support from the June low at the low yesterday:

Good arguments for a break either way from here. We’ll have to see which way the triangle breaks. Until then 1409 looks a decent risk/reward short entry and 1395.5 a decent long entry as long as triangle resistance has been tested first. The next obvious move within the triangle is to triangle resistance at 1409.5 and a test of triangle support before that happened would have a higher probability of seeing that support break. 

Topping is a Process (by Springheel Jack)

By -

I posted the SPX chart below in my MarketShadows post at the weekend and I'll post it again this morning. You can see that full post here. It shows the very ambiguous close on Friday at the retest of broken support and at resistance on the declining channel from the high. I sketched in two topping options if we see a break up from there this morning, and they are that SPX has made the first high and valley low of a double or M top, or that SPX has put in the left shoulder of an H&S pattern. Either of those would obviously allow the current high to be tested or exceeded:

(more…)

Update on My Favorite Long-Term Short: ODP

By -

Back in May 2011, I originally posted about shorting Office Depot.  The idea is finding a sector with three competitors, with margin compression, struggling for survival in a crummy economy.

At the time, ODP was at $4.16.  Since then, its only bright spot was during the rising Ctrl+P tide of early 2012; but reality seems to have returned… and as of this writing, the stock sits at $1.63.

Img1

(more…)

Mousetrap Victims

By -

They say that if you build a better mousetrap, the world will beat a path to your door.

I suppose that's partly true, but no one really thinks about whoever it was that was in the business of dealing with the mice beforehand. They're going to suffer, because it's their doorway that will suddenly find itself as empty as a hermit's address book.

I present to you below four long-term charts of some companies that were on the losing side of mousetrap creation. They have several things in common:

+ At one time, they had valuable, thriving common stock;
+ They were leaders in at least one technological field;
+ They allowed competitors (like, oh, say, Apple) run off with their market by creating something better;
+ Their stock has since entered a death-spiral

Some true believers of these securities might point to Apple from 1996 as the kind of turnaround they anticipate. My retort would be that there's pretty much only one Apple on the planet, and I can't really think of any other company in the tech field (except, I guess, IBM from the early 90s) that has risen from the ashes.  

(more…)

Stock of the Century

By -

I know I've mentioned WalMart before as a breathtaking stock, but I feel compelled to mention it again as it is pushing to never-before-seen highs in an otherwise boring market.

People point to Apple as the ultimate "gee, if only I'd bought it" stock, but WalMart puts Apple to shame. If you had bought AAPL at the IPO (and held on during the gut-wrenching ups and downs before it finally found its footing about a decade ago), your gain would be 15,000%. Not bad!

WalMart, on the other hand, is up more than 190,000%. There's a reason that Sam Walton's fortune, even when broken up into little pieces among relatives, since puts all of them near the top of the world's richest people.

Even though WalMart is sort of a running joke, it's undeniable that this must be an astonishly well-managed organization. They say you can't argue with success, so I would suggest that any arguments against WalMart would be swiftly snuffed out with just one glance at the chart below. If God himself came down and said this would be a $200 stock in a few years, I wouldn't have any reason to doubt it.

0710-wmt