

Slope of Hope Blog Posts

Slope initially began as a blog, so this is where most of the website’s content resides. Here we have tens of thousands of posts dating back over a decade. These are listed in reverse chronological order. Click on any category icon below to see posts tagged with that particular subject, or click on a word in the category cloud on the right side of the screen for more specific choices.

The Butterfly Effect (by Springheel Jack)

By -

The famous Butterfly Effect is the idea that small changes in a non-linear system can cause large differences to a later state. The idea is that a butterfly flapping its wings in (say) Greece might cause a hurricane to form in (say) the US. I'm no expert on butterflies but I can say with confidence that in the current market any eruption of wind from a greek politician or from one of the many empty heads of state at the G-20 in Cannes may show up in equities moments later. Be warned, and let us all hope that politicians in Europe everywhere today can avoid eating brussels sprouts and baked beans, as well as sounding off to journalists. 🙂

Notwithstanding the news, the technical picture is looking bullish on balance today, though less strongly than it did yesterday morning. It's less strongly bullish mainly because a number of instruments are at resistance levels, though there are a lot of bull flags forming under those levels. On ES the W bottom I was looking at yesterday has been playing out and if resistance at 1260 breaks then I'd expect a run further up. The bull flag target would be in the 1280 area:
(more…)

Shotgun Wedding (by Springheel Jack)

By -

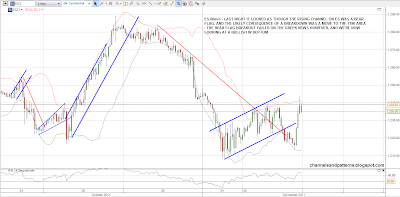
A wild night on the futures. First the rising channel / bear flag broke down at 1225 and looked as though it would break down towards main 1190 area support today, then news came that the greek referendum was most likely cancelled and there was a wild recovery, with ES up over 30 points in five hours. News apart, the development now looks bullish for equities, with a higher low on ES and a possible W bottom made:

On NQ, a new low was made at a key support level and on sharply positive divergence. that now looks like a W bottom very similar to that seen at the October low on SPX. Declinng resistance from the highs has broken and NQ now also looks bullish:

(more…)

Looking for Bounce Here (by Springheel Jack)

By -

What do the dates 1826, 1843, 1860, 1894 and 1932 have in common? They're all years when the Greeks defaulted on their debts in the last two centuries. Greece has been in default for approximately 50% of the time since it gained independence. The Greeks aren't even particularly remarkable with this track record. Over the same period Venezuela and Ecuador have each defaulted ten times.

Governments defaulting on their debts used to be a common occurrence and it's a useful safety valve for profligate governments that won't balance budgets, and don't mind wiping out a large proportion of the nation's savings regularly. Spendthrift small countries used to default regularly and still do in South America particularly. Sometimes they make a fresh start and behave better thereafter, and sometimes they just do it all over again.

(more…)

Greek Referendum Plunge (by Springheel Jack)

By -

There's little appetite for austerity in Greece, as we've all been seeing from the intermittent riots over the last few months. The Greeks announced yesterday that they would be putting the latest Euro bailout and greek partial default plan to a referendum and obviously the plan may get rejected. I have found no date for this proposed referendum looking round this morning, so this bump on the road may affect markets for quite a while yet.

Kudos to my friend Alphahorn for calling the high and going in heavily short there. He's given me permission to post his current primary count after yesterday's bearish break and he is expecting new lows from here on that count:

(more…)

No Man’s Land (by Springheel Jack)

By -

I posted a channel derived from my friend Alphahorn's chart on Friday, but I regretted not posting the original chart to give the proper context. Alphahorn is running a primary bearish scenario and a secondary bullish scenario, and the high on Thursday was pretty much exactly at the dividing line between the two. Here's the full chart below, and if the red declining channel breaks up, then the bullish scenario will become Alphahorn's primary scenario:

Is this level the dividing line between a continuing bear market or a new bull market? Another indicator I watch suggests that it is, and that is the ichimoku clouds on the SPX weekly chart. Historically a break below the cloud has been a decent indicator of a bear market and a break above a decent indicator of a new bull market. as you can see SPX is testing the top of the weekly cloud. A break above with confidence would strongly suggest that SPX is in a new technical bull market:

(more…)