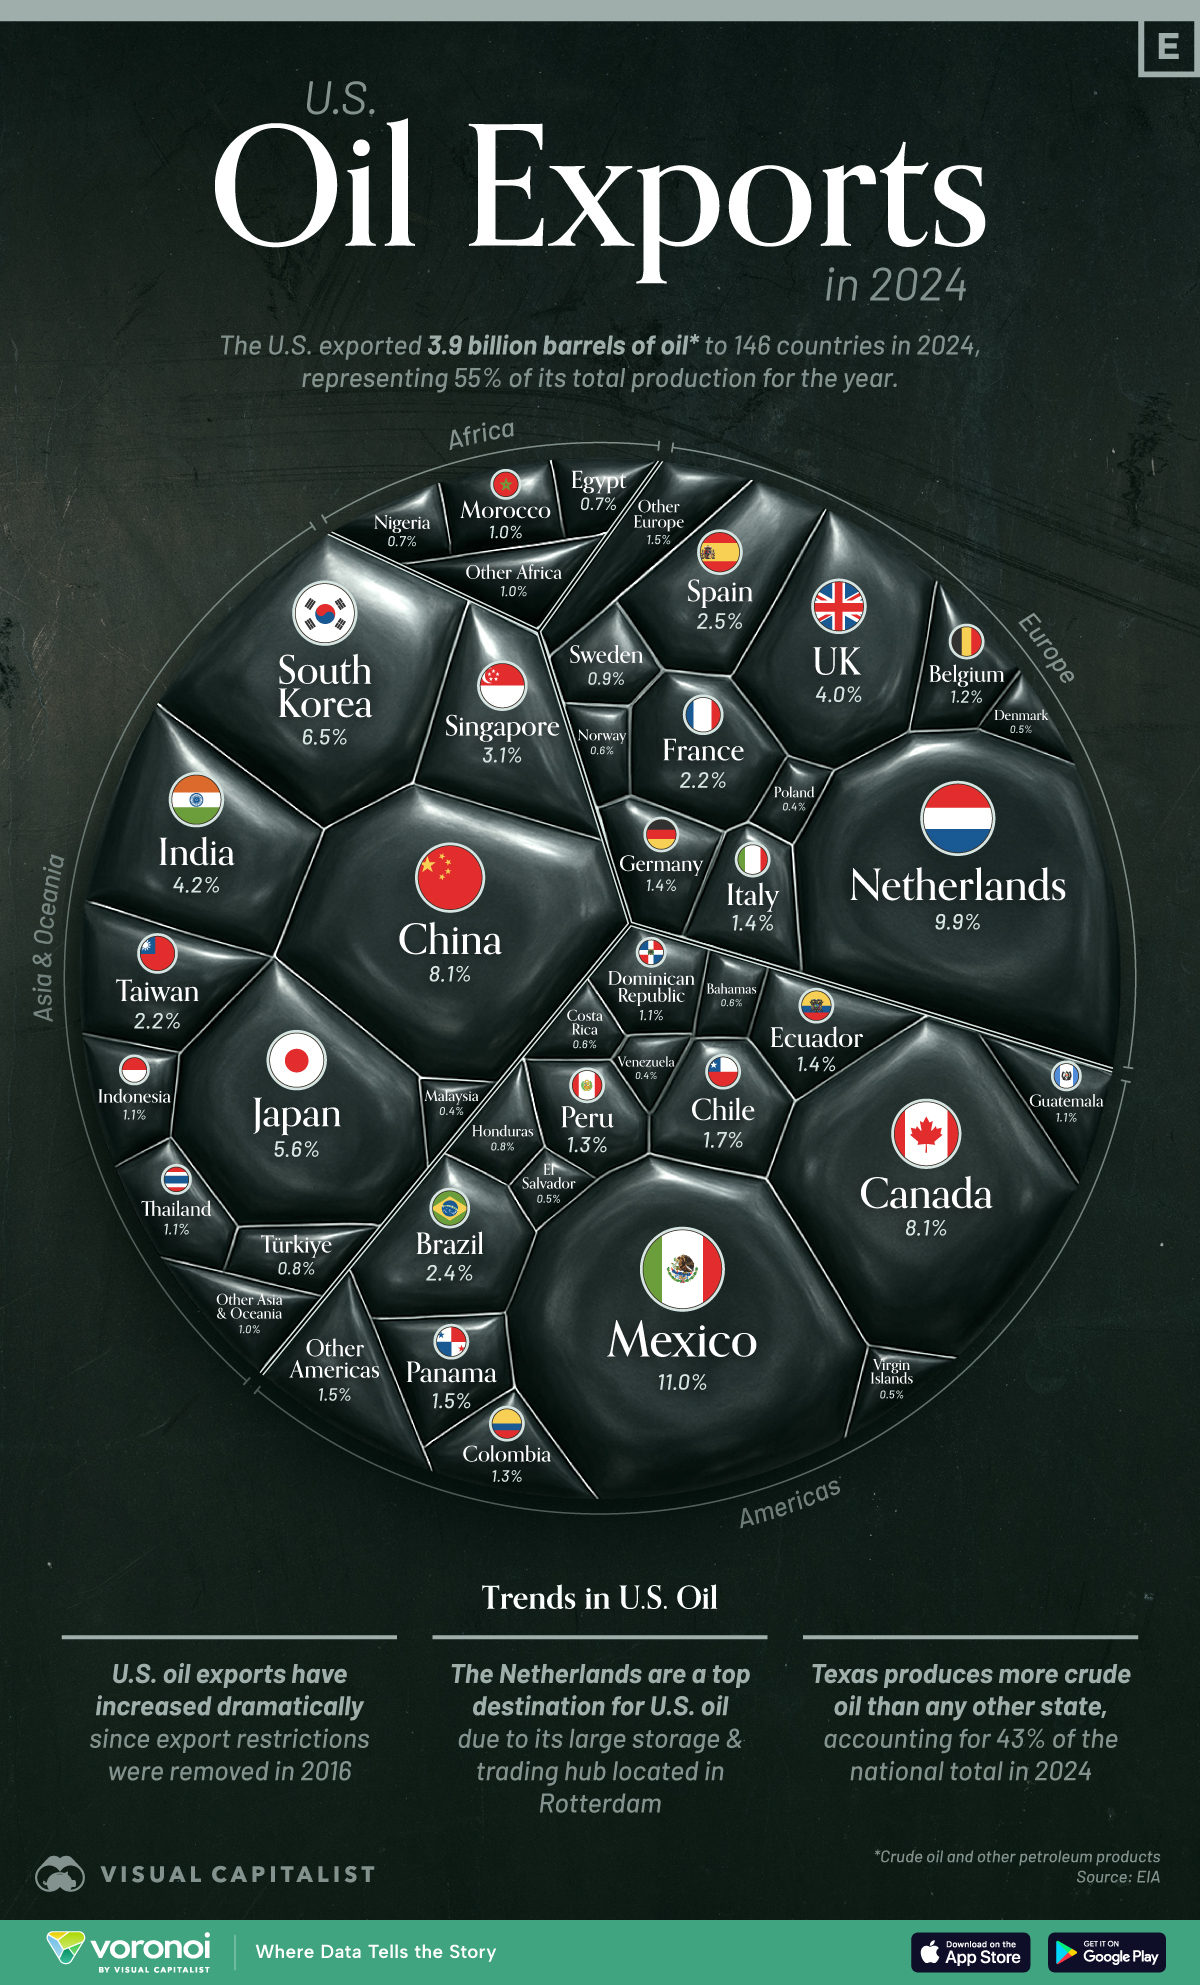
This quilted-looking graphic has some surprises, including the fact that the Netherlands (of all places) buys more of our oil than China.

Slope initially began as a blog, so this is where most of the website’s content resides. Here we have tens of thousands of posts dating back over a decade. These are listed in reverse chronological order. Click on any category icon below to see posts tagged with that particular subject, or click on a word in the category cloud on the right side of the screen for more specific choices.
This quilted-looking graphic has some surprises, including the fact that the Netherlands (of all places) buys more of our oil than China.
Below is a plot of the economic center, geographically, for the past couple thousand years. The massive shift from 1820 to 1913 was thanks to the U.S., whereas the equally large shift from 2000 to 2025 was due to China.

The so-called Liberation Day was five months ago, although it feels like fifty. The general idea was that ‘Mericuh was finally going to show them danged for-ners was the good old U.S. of A. could do when it set its mind to it, and with the aid of triple-digit tariffs, we were going to reclaim a 1950s style industrial economy.
Whether that transpires or not remains to be seen, but let’s just at least agree that the stock markets of other countries don’t seem any worse for the wear:

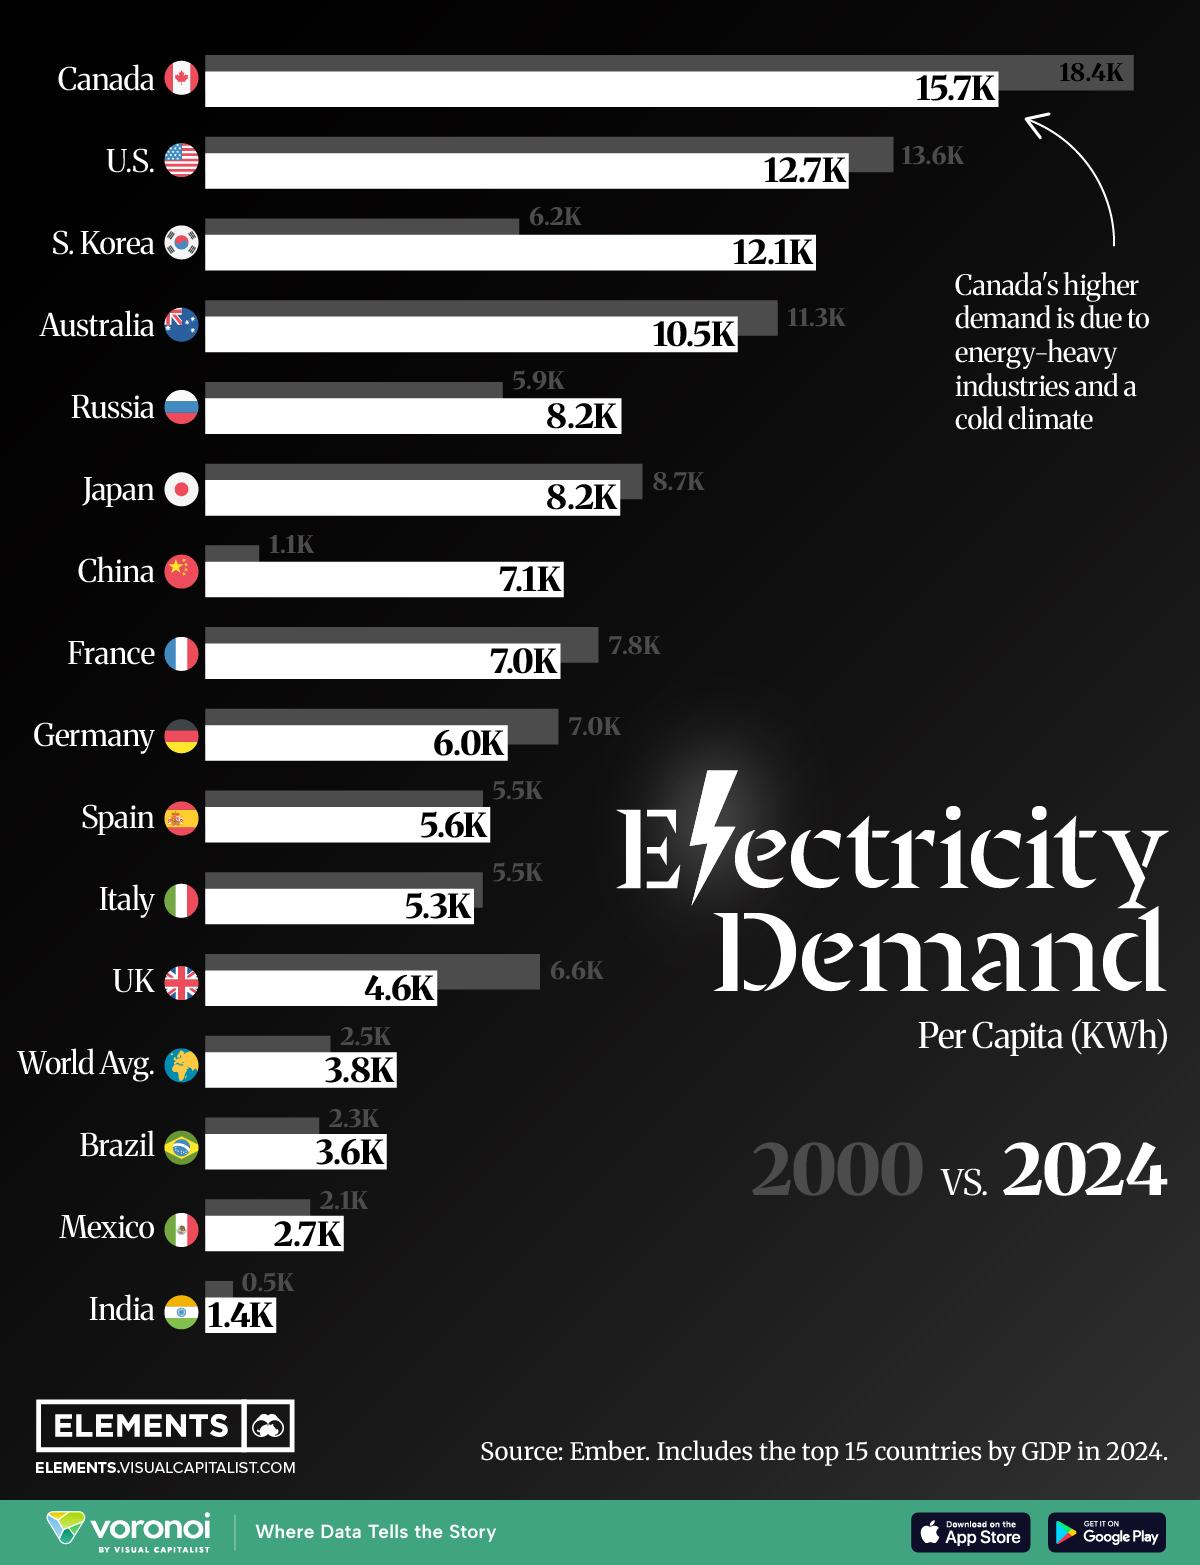
Here is an interesting breakdown of per-capita use of electricity (white bar) and what it was at the start of this millennium (grey bar). Canadians use the most (cuz it’s chilly, I guess?) whereas, for whatever reason, the U.K, not only is a modest user but has cut back quite a bit. Speaking for myself, the good people at Palo Alto Utilities charge me over $1,000 per month, most of which is for electricity.