The bears have had some decent opportunities this week, but each time the bulls have reeled them back and pushed up a bit further. With just a little more upside NDX is close to another test of falling megaphone resistance, and if NDX can break over that and hold above that trendline, then a major obstacle to more upside is cleared. NDX 60min chart:
Slope of Hope Blog Posts
Slope initially began as a blog, so this is where most of the website’s content resides. Here we have tens of thousands of posts dating back over a decade. These are listed in reverse chronological order. Click on any category icon below to see posts tagged with that particular subject, or click on a word in the category cloud on the right side of the screen for more specific choices.
EEM vs SPX
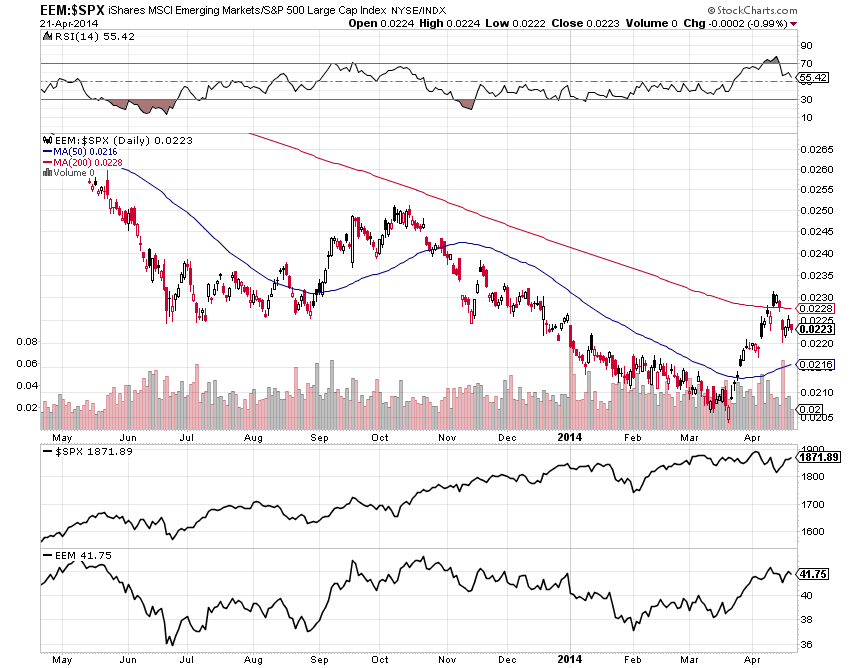
I’m watching emerging market weakness vs the S&P 500 to see if weakness persists, or whether investors increase their risk appetite and place their bets on emerging market recovery.
If price breaks and holds above the 200 MA shown on the Daily ratio chart below of EEM:SPX, we may finally see a recovery on the horizon. Otherwise, look for extreme weakness if price falls and holds below the 50 MA.
Bullish Tuesday vs Key Resistance
Yesterday was a very dull trading day that almost achieved complete meaninglessness, avoided only because SPX held above the daily middle band all day, closing 12 points above the middle band. SPX is therefore consolidating above the daily middle band and the next obvious target on the daily chart is the daily upper band, now at 1897. SPX daily chart:
Wait For It…….
All four days this week have been about recovering from last week’s action; I suspect/hope the unraveling can resume on schedule next week. Aligned with that, Japan is setting itself up for a bigger fall than we’ve seen for a while. If DXJ can fight its way back to about $47, I think it will provide the proverbial lay-up shot of a shorting opportunity.

Emerging Fear
My largest short heading into the day was EEM. In spite of yet another ridiculous mini-rally this morning, things are once again falling to pieces. As the daily chart shows, the repetition of buying-based-on-unicorn-farts followed by a stall (tinted thrice) and then a plunge-based-on-reality is getting a little predictable.