Slope of Hope Blog Posts

Slope initially began as a blog, so this is where most of the website’s content resides. Here we have tens of thousands of posts dating back over a decade. These are listed in reverse chronological order. Click on any category icon below to see posts tagged with that particular subject, or click on a word in the category cloud on the right side of the screen for more specific choices.

Occam’s Razor and a Road to 870 SPX (by Springheel Jack)

By -

(Editor's Note: this has got to be one of the coolest, cleanest, most interesting guest posts ever; wow! Thanks, SJ! – Tim)

After the amazing day yesterday I have spent a lot of time reviewing
various charts. The first thing I have looked at is the wave count on
SPX. After yesterday I don't think there can be any real idea left that
the low on May 6th was just a 'fat finger' error. It was a powerful
third impulse wave down, and the wave count so far looks pretty obvious
from the SPX daily chart, even though I definitely wouldn't regard
myself as an EW expert.

Whether we are in the first wave down of an ABC correction, or of a five
wave bear market move, doesn't really matter at this point. I favor the
first scenario for longer term reasons that I'll explain in a weekend
post soon, but until we reach the end of the third wave down, it doesn't
make a lot of difference.

For this first wave down though, it seems obvious enough that the first
subwave bottomed at 1181.62, and that the third subwave bottomed at
1065.79. Subwave 4 was almost exactly a 76.4% fib retracement of wave 3,
topping out
out a few points below the bottom of wave 1. The subwave 3 low was taken
out on ES last night in what is obviously the current subwave 5.

Occam's Razor tells us that the simplest explanation is often, if not
usually, the correct one. I've seen a lot of EW counts over the last few
weeks, but this count looks to be the simplest and most obvious
explanation, and more than likely it is the correct one:

100521 SPX Daily Wave A EW Count

Where will this first wave end though? The third subwave down was 143.57
points, and the fifth subwave will probably be shorter, though not
necessarily. From the subwave 4 top at 1173.57, that would give a likely
wave range down to 1030 SPX for the completion of the first main wave
down.

The target of the broadening bottom that I posted yesterday was 1044 ES,
which is very close to the February low and would be a good subwave 5
target. If we do bottom there, it would strengthen a pattern setup that
would be pure chartist poetry for the next two waves of this bear move.

It would confirm that there is a right angled and ascending broadening
formation on SPX (66% bearish) and would also finish the head for a huge
head and shoulder pattern within that broadening formation. Both
patterns would indicate to the July low at 870, at what was (or is) the
most important support and resistance level for the bear market. We
would reach the top of the right shoulder on the next main wave up, and
then the third main wave down would carry us through the neckline to the
target:

100521_SPX_Daily_RAABF

The strangest thing about yesterday was the powerful move up in EURUSD
at the same time as the powerful move down on ES. This may signal that
the usefulness of this positive correlation between the two is at an
end, but I suspect it just means that ES is lagging EURUSD by a few
days, and that after making an interim bottom on ES shortly, we will see
that return to normal. I hope so, as EURUSD has been a very good
indicator for equities for quite a while now, and if the correlation
fails completely, that will be a great loss.

In the short term, the IHS that I posted yesterday has now formed,
broken the neckline and started to play out. The target is 1.282:

100521_EURUSD_60min_HS_Pattern

That's what I would expect from EURUSD, which bottomed where I expected
it to this week within the current broadening descending wedge. These
wedges are very good performers on EURUSD, as I mentioned earlier this
week, and as you can see from this weekly chart of EURUSD over the last
few years.

The only wedge that failed to make target on this chart was the
broadening descending wedge that ended in late 2008, and that target
failure was signalled both by the pullback in early 2009, and by the
boundaries of the subsequent rising wedge. Another interesting thing to
note on this chart is the rising wedge into mid-2007 that broke up, as
rising wedges do 31% of the time. I mention that because EURUSD is
currently in a broadening descending wedge, and these break down 45% of
the time.

Barring imminent apocalyse though, EURUSD is due to correct up to the
top trendline of the current broadening descending wedge, currently at 1.33 and
declining rapidly. We may see a period of sideways trading where EURUSD
slowly moves towards the line at a lower target of 1.282 to 1.30, but we
are due a bounce here and one seems to have started already. During
such a period, we would expect to see SPX trading up or at least
sideways. It is disturbing that we haven't seen that since EURUSD
bottomed early on Wednesday morning:

100521 EURUSD Weekly Wedges

The right-angled and ascending broadening formation is perhaps the
characteristic pattern for where we are right now on equities. There are
quite a few of these as well as broadening tops across various indices.
Here is another example of one on the FTSE, and seeing these is a large
part of the reason why I think that if we don't bounce soon, then we
may fall a great deal further over coming weeks.

As you can see from this chart, we are right at the bottom of the
pattern, and it is an ominous sign that after a partial rise, the FTSE
has returned to retest the lower trendline. That signals an imminent
downward breakout 81% of the time, but until we see SPX break support at
the February low with conviction, I would regard it as subordinate to
the SPX pattern, as the FTSE is really just one tail on the SPX dog.

If SPX does break support there though, and then takes out the November
low at 1029.38, then this subwave 5 would be longer than subwave 3 down,
and the potential would open up to go a great deal lower in the coming
weeks.

100521_FTSE_Daily_RAABF

In that event the recent action on the daily chart for 30 year US
treasuries would also look very ominous. For the past year, these
treasuries have been trading in a large rectangle, and have broken up
from it this week. These aren't always reliable when they take more than
a few months to form, and the eight month rectangle on XLF that broke
up in April failed to make target at 18, but FWIW, the target is 134,
which is what I would expect to see if we get a very major flight from
risk over coming weeks.

100521_30YrTBill_Daily_Rectangle

So there we have it. We bounce very soon, or equities continue falling
into a chasm of unpredictable depth. Should be fun either way, but it
will be a lot easier to trade this if we do bounce, so that's what I'll
be looking for here.
SPX Channels (by Springheel Jack)

By -

We saw a new high on Friday, and it is very likely now that will be
followed by further new highs over the next few days. Looking at my SPX
channels chart the next upside target is in the 1232 to 1235 area on
SPX, if we reach it this week. It will be somewhat higher if we reach it
next week as the trendline is rising:

100426_SPX_60min_Wave_5_Channels

In the very short term though, we may well see some weakness early this
week as we appear to have established a new short term rising channel on
ES, and we are near the top of it:

100426_ES_60min_New_Rising_Channel

That said, it is definitely a day to be cautious on the short side as it
is Monday, and as I posted the other day, 26 of the lasted 30 Mondays
have closed green. Of the four red closes, two of those closed down less
than 2 points and the other closes were only down 12 and 14 points
respectively.

Within the last 30 Mondays though, the two longest series of positive
closes were of 8 closes in a row, and one of those series is the last
eight Mondays. Even by recently bullish standards therefore, we are
overdue a red Monday and we may see one of those today.

I'm expecting to see more consolidation in USD during the next few days,
but again, that may well not apply today. Over the last few days on the
60 min chart, DX has been forming a broadening ascending wedge that is
still holding well, and if it reaches the next upside target, that will
be near to a new high. After (and if) the wedge breaks downwards, I am
expecting a retracement to the 80.6 area before the next USD wave up
begins:

100426_DX_60min_BA_Wedge

I've been having a look at GBPUSD over the weekend, and it has been very
marked how relatively strong Cable has been relative to the Euro in
recent weeks. I'm not expecting that to last and after some further
upside with a target in the 1.56 area I would expect to see a strong new
wave down towards a new low below 136.94. I have put an EW count of
where I think we are on the daily chart along with the current rising
channel:

100426_GBPUSD_Daily_Channels_and_Count

There are some other reasons to think that GBPUSD can expect further
weakness though in that there is a general election at the end of next
week that looks likely to produce another weak and divided government
with little or no commitment to putting the UK's fiscal house in order.

That matters a lot as over the last thirteen years the incumbent labour
government, which is largely funded by the unions, has gone on  the
largest spending spree in UK history. A million new government employees
were hired, government spending ballooned from 38% of GDP to 52%, and
the budget deficit is 12% of GDP, which on a par with Greece. This has
resulted in a situation where over half of the UK population receives
over half of their income from the government, either in salary or
benefits, and the parties competing for power are largely doing so on
the basis of maintaining government spending and increasing taxes on the
dwindling number of UK residents with assets in order to do so.

It is hard to see this situation ending well, and unless there is an
outright majority for the opposition conservatives next week, which
looks very unlikely at the moment, then the situation is likely to get
worse until the UK has a currency and debt crisis as it did in 1976
under the last labour government.

Good luck trading today everyone.

Mole’s Quick And Mostly Dirty Weekly Forecast

By -

<shameless plug>The following was available to Evil Speculator subscribers over the weekend. Unlike other subscription blogs Evil Speculator has been shifted towards a hybrid system in which important analysis and trade ideas (i.e. symbols, setups, etc.) are available to subscribers first but are later opened to a general audience. If you are 'evil speculator curious' drop by for a visit anytime – we're up to no good on a constant basis.</shameless plug>

Alright, let's dig right in:

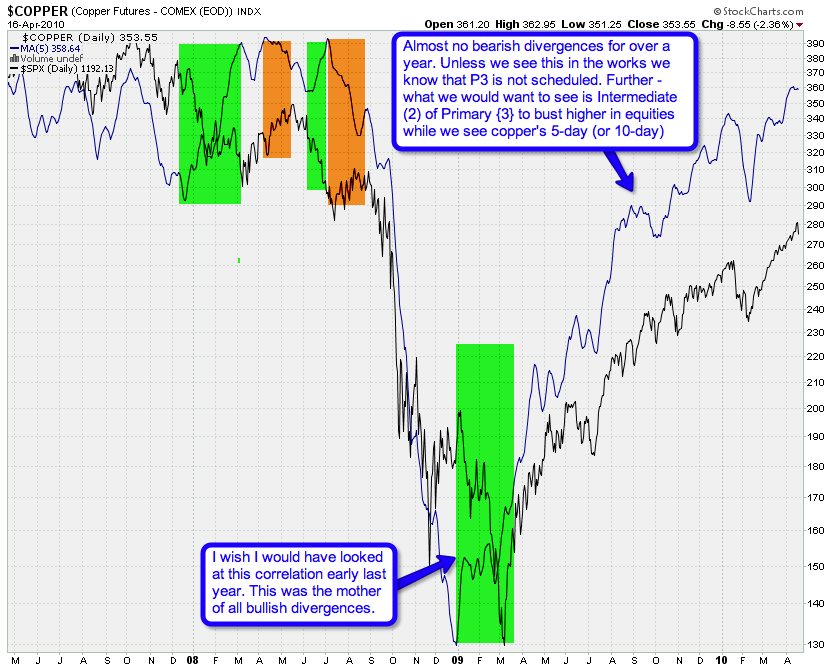
We are thinking long term here. This is my radioactive fusion
powered 5-day MA Copper/SPX chart. The MA is on the Copper futures and
what we are looking for are long term divergences. Yes, long
term – the short term is way too noisy for me to attach any
interpretations. Quite salient is the ‘mother of all bullish
divergences’ in March of 2009. Wish I would have seen this one back
then as it would have helped in assessing the timing of the finale of
the trend.

But wait – there is more. Let’s project forward a little and
consider what ‘may’ happen if we get something that may look like the
onset of Primary wave {3}. After the first major drop we would a see
snap back into Intermediate (2) – which should not be confirmed by the copper futures.
Remember – we are looking for divergences in the scope of Primary or at
least Intermediate degree moves. Anyway, it’s a good theory – for now –
let’s keep an eye out and put it into context along with some of the
other charts I’m peddling here.

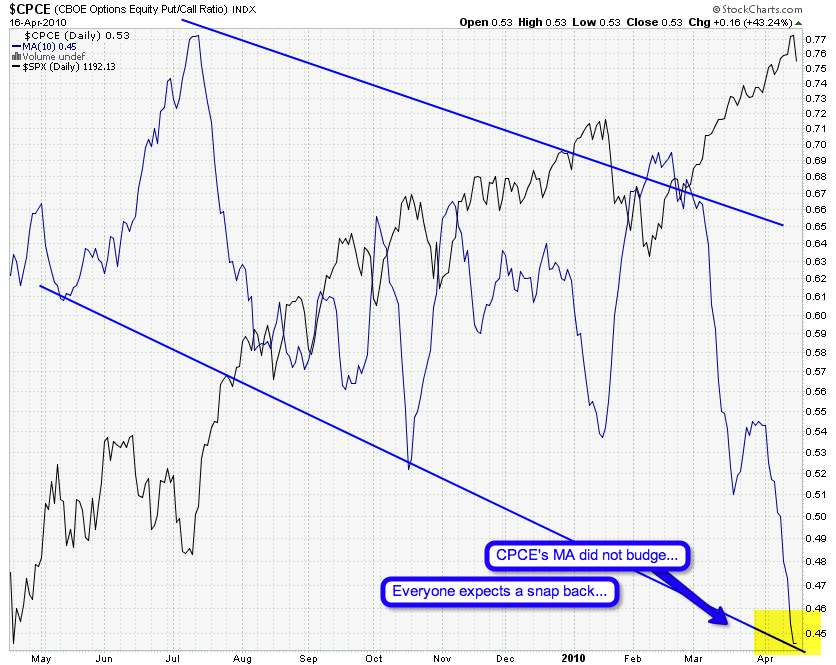
That’s this week’s shock and awe chart – I’m shocked that
the CPCE’s 10-day SMA did not budge after Friday’s drop. My take – the
bulls see this as nothing but yet another dip buying opportunity. Well
– we shall see shortly.

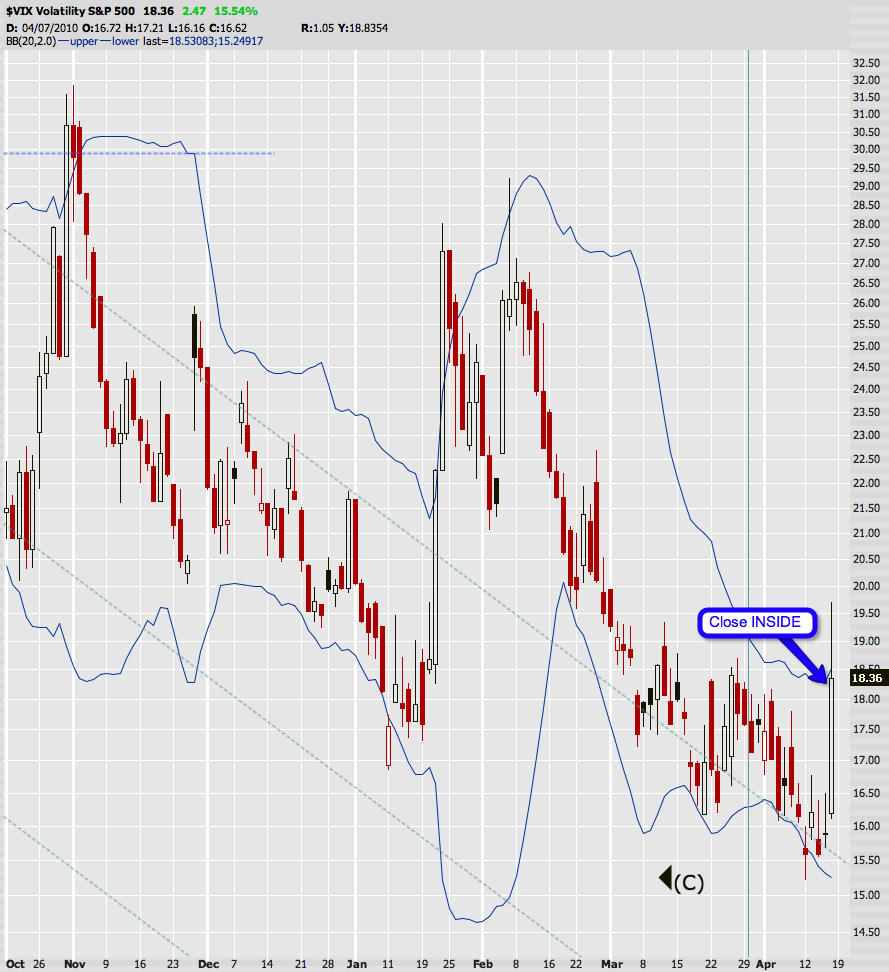
During Friday’s session got dangerously close to busting outside the
upper border of the 2.0 BB on Mr. VIX. Fortunately we did close inside
– meaning no buy signal (yet). Doesn’t mean we won’t get one though –
IMNSHO we might see a repeat of what happened late January.

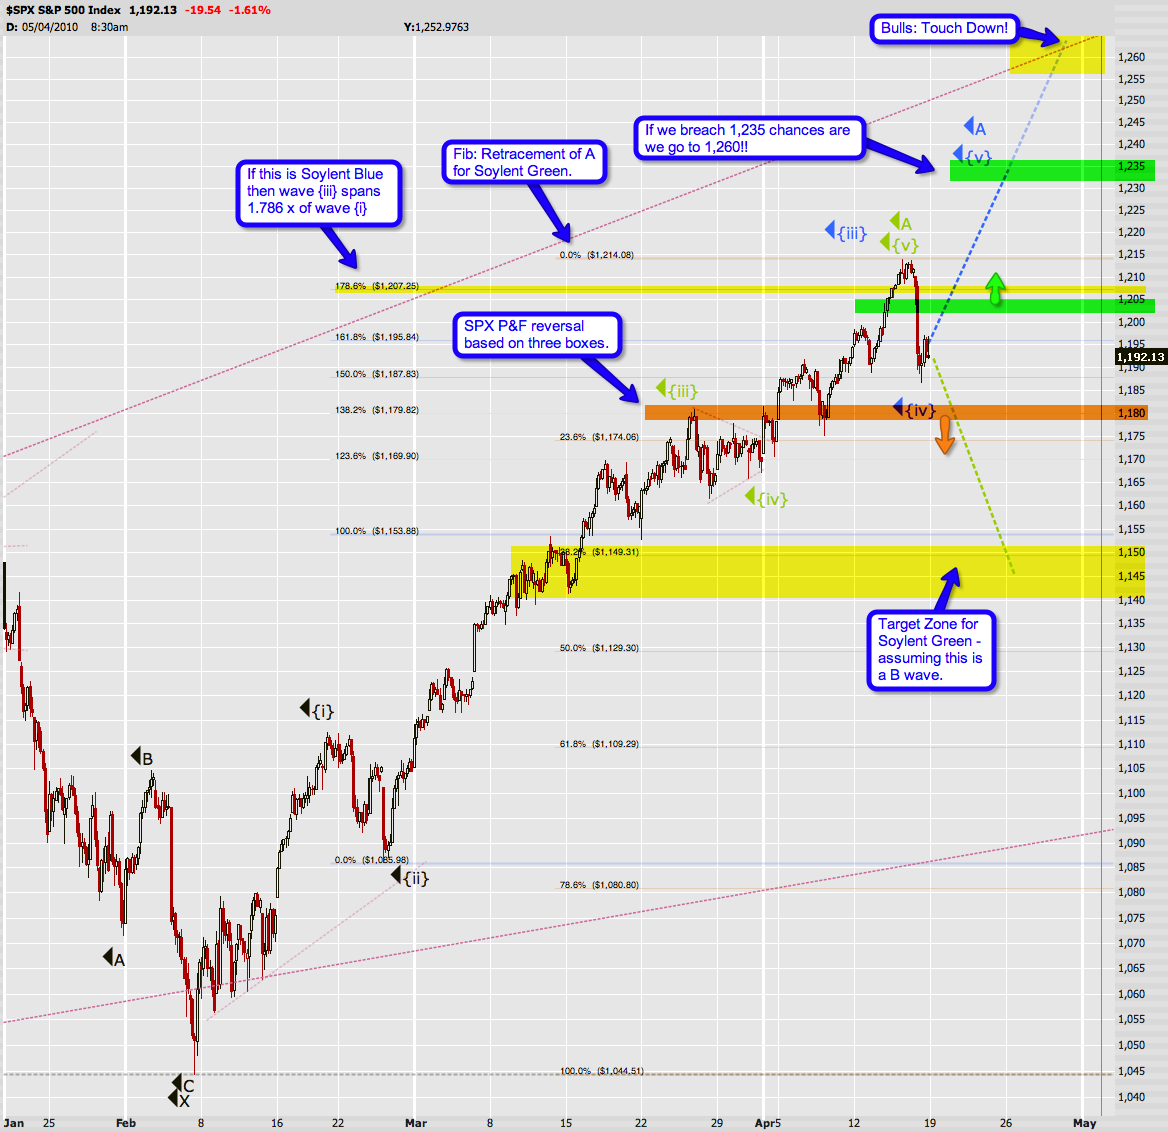
I’m no P&F pro but that upper trendline I pointed out last week
seems to have served as resistance – thus far. If we get a drop to
1,180 on the S&P 500 cash index this chart would show a first
circle as a possible beginning of a downtrend. Not sure if that is a
‘confirmation’ of a reversal but it does count and becomes part of the
chart, so let’s just go with that unless we hear otherwise from a
P&F pro. I have highlighted the 1,180 mark on my wave count below
as well:

2010-04-18_SPX_count

You might want to open this one in a separate window/tab by clicking
on it – it’s got quite a lot of detail. I won’t repeat all my comments
here but suffice to say that I have a feeling that things are slowly
shifting back into focus now. The retracements all line up quite nicely
and we might just have ourselves a map here.

Soylent Blue means that we are either done with Minute {iv} or will
be by around 1,180 – that P&F reversal point I highlighted above. I
postulate that we may bounce a bit before that and keep it off the
P&F chart – but that’s just a theory. If we keep dropping through
that point Soylent Green becomes a lot more realistic. The target for
Green is the 1,145 cluster as we are near a respectable fib lines, i.e.
38.2% on the way down and 100% of {i} on the way up. That’s right – I’m
the tamer of ferocious fib lines – Siegfried & Roy have nothing on
me ;-)

Some other comments on the chart – I think it’s a decent map – keep it handy as next week unfolds.

Cheers!

Mole

Have we just seen the wave 5 top on SPX? (by Springheel Jack)

By -

I've been looking at SPX this morning and the evidence that we may just
have seen the end of wave 5 of 5 looks compelling. If so we have just
made a major top. Let's consider the evidence.

Firstly I was
looking at ES this morning and I see that a possible H&S pattern is
forming with the right shoulder on that pattern developing now. Looking
further at it and dropping my preconception that a rising channel is
forming I now see that recent action fits much better with a rising
wedge:

100416 ES 60min Wedge and HS Pattern

Now
I am fairly convinced that we are in wave 5 of 5 up from the low in
March 2009 here, though we may instead be looking at a wave 3 extension
for the bearish interpretation. What we are looking at here is a
textbook wave 5 termination pattern and I have an example from EWI of
one here for comparison:

100416 EWI Ending Diagonal Rising Wedge

Looking
at the SPX chart for the wave 5 of 5 up since the Feb 5th low, I have
marked in the wave count for what I think now looks like the highest
probability count unless we make a new high today:

100416 SPX 60min Wave 5 Channel

To
add further weight to this scenario, jacksoo pointed out this morning
that we hit significant resistance yesterday on a line drawn from the
November ES high:

100416_ES_Daily_Trendlines_and_Patterns

This
all adds up to a compelling scenario that this wave top may well now be
in. There is still some room for upside in the rising wedge of course,
and there is also a little wiggle room on the resistance trendline from
the November high, depending on how it is drawn, but not much. If that
H&S finishes forming today then I think that it will signal an
excellent short on a break of the neckline at 1201.5 ES, at which stage
the rising wedge will also be at breaking point. If the lower trendline
of that rising wedge, currently at 1203 ES, is broken on an hourly
basis, then that will also be a signal to position short.

If the
wave top is in, then we should now at minimum now see an abc retracement
that should take SPX back below 1100. If the move since March 2009 has
been a rally rather than a cyclical bull market though, then the top may
be in, and we could then be starting a move towards a new low.

One
caveat of course is that wave 5's can extend too. As ever in this
strange market, some caution is required. Good trading everyone!

Elliott Wave Principle Thoughts (by Nathaniel Goodwin)

By -

At great risk of being
cyberbullied here on this site, I thought I would share some of my thoughts on
EWP.

When I use EWP, I really only apply it to the indexes on a larger
time frame, usually daily or weekly charts. Sometimes it works well for me on
individual stocks on a much shorter time frame; but with that said, I feel that
waves are sometimes manipulated on short time frames 1-5 min charts. Motive
waves morph into a complex corrective patterns frustrating day traders using
EWP. It would kill me if I relied on it solely, I need other tools to show me
if the stock is overbought/oversold or signs of divergence.

I have spent many hours studying EWP and NeoWave,
many more hours than the average adult male of my age. It sort of disgusts my
mom, she always wanted me to go enjoy the outdoors with friends or maybe find
some sort of female woman to make babies with so the Goodwin name would live
on. Instead I wasted my time counting waves like some loser douche bag in my
bedroom (that's what she said-my mom).

I don't subscribe to EWI, NeoWave or any other subscription site
(I do have a good idea of what their counts are though). I don't really visit
many Elliott Wave blogs (some of those are great when one is trying to learn
EWP, but I would never use them for real trading). I also do not pay much
attention to any count I see on less than a daily time frame; I get lost in the
squiggles, see many errors and lose focus on the big picture. One of the
biggest problems I see with Elliott Wave is that when everyone is looking for
the same wave count, that count is quickly invalidated; which is one reason
Glenn Neely came up with NeoWave – an evolution of traditional Elliott Wave. He
claims that Elliott Wave/patterns have and will continue to change as more
people use it.

Learning how to use EWP and having confidence in my own counting
is what I strive for, not saying my count is right or that count is right. The STU updates over at EWI has had about as much success as my own counting over the
past year, maybe a little less. I always keep several counts, bullish, bearish
and neutral. When one gets invalidated, I remove that count and go on from
there. Nobody knows what is going to happen tomorrow or next week/month, I feel
that one needs to be very flexible and quick to change their mind if they want
to practice EWP. It has cost me greatly to be too stubborn with a certain
count, and there have been times when I totally scrap EWP for months at a time
while the market does whatever, then revisit EWP to see if something is making
sense.

Here is an example of one of my counts, one of six right now. It
is very flexible and not necessarily looking for P2 to end and the devastating
P3 to begin, although that is certainly possible. Moving around the larger
ABC's or changing a couple of the larger ABC's to 123's, one might see that
this sort of count could change to very bullish or become neutral depending on how we
proceed from here in the next few weeks or months.

SPX
 

Look, I really believe a monkey can count waves. The tricky part for
me is how fast I can/am willing to accept changes in my wave count, or
accepting that I'm wrong all together. I don't get pissed off of at some blogger or that STU guy at EWI, learning how and gaining the confidence to do it myself is what I
strive for. If I can't do that, I scrap it for a bit and use other tools until
the waves start making sense again.

Flame on.