Some people regard private enterprise as a predatory tiger to be shot. Others look on it as a cow they can milk. Not enough people see it as a healthy horse, pulling a sturdy wagon.
Winston Churchill
I'm sleeping badly this week and I'll probably skip trading today though I have some equity longs I'll leave on as I'm leaning bullish. I'll keep the post relatively short too as I've started late and the market prospects today can easily be summed up in a couple of charts. First though I've been meaning to talk about a popular myth that I often see referred to, and that is the myth that stock market performance is unrelated to economic performance.
Over shorter timeframes, as with some other popular myths, this can be true, but the apparent lack of correlation vanishes over longer timeframes, as you would expect logically of course. Those longer timeframes are of course the generally 15 to 20 year periods of the secular bull and bear markets.
There's a reasonable (and concise) view of these periods since 1906 in an article here, and it's well worth a look to give the overall context of the current period that we are trading through now. Looking at the last 60 years though, the secular bull market period 1950-1966 was a very strong period for equities at the same time as a period of strong economic growth. During the secular bear market 1966-82 economic performance was weak and equities lost value in real terms. In the secular bull market 1982-2000 we saw another very strong period for equities at the same time as a strong period for economic growth. That growth was slower than earlier bull cycles but it is a fact that economic growth slows down in more mature economies, possibly because of the higher proportion of government spending and consequent crowding out of the private sector. In the ongoing secular bear market from 2000 growth has been weak and fitful and equities have again lost value in real terms. The chances are that will continue until this secular bear market ends, most likely in the 2015-2020 period.
What's also interesting are the reasons that economies and equities have peaked and then corrected. My favorite book on this subject is Galbraith's The Great Crash 1929, which also has a very illuminating foreword written near the peak of the 1950-66 secular bull market. Galbraith talks there about the role of leverage in the great bubble of the 20s, and then talks about the rediscovery of the power of leverage in the late 50s, a key factor in the bubble that culminated in the mid-60s, and the painful deleveraging period that followed during the next secular bear market. You could reasonably assume reading this book that not only do these cycles look fairly similar, but the causes of the booms and bust look rather similar as well.
Those who cannot remember the past are condemned to repeat it. – George Santanaya
What we have learned that is new in this current cycle though, is that even with famous scholars of previous cycles (Ben Bernanke), in key policymaking positions, all policymakers are managing to do is find new ways to make the same old mistakes. A slightly dispiriting refutation of the implication of George Santanaya's quote above, which is that if you study your history, you have less chance of repeating previous mistakes. Perhaps by the time the next secular bull cycle is peaking in the 2130s policymakers will have managed to learn something useful.
So how does this apply to us today? Well the first thing to note is that of the three secular bear market periods since 1906, the shortest lasted 16 years and the longest lasted 20 years. Realistically therefore, there is no good reason to think that this current secular bear market will be any shorter, not least because we can easily see around us that the policy response to overleveraging has been denial and a 'pretend and extend' policy based on the idea that if the problem can be brushed under the carpet long enough, it will somehow resolve itself. That seems unlikely, current policies look likely to end in a major sovereign debt crisis, which will lead to austerity and/or inflation, which should end the secular bear market cycle after another major downswing in equities.
Anyway, that's economic cycles history 101 concluded for today so let's see how the markets are looking in the short term.
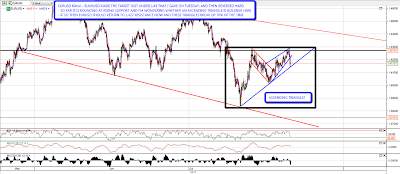
A very key chart for today and the next few days is the EURUSD chart. Overnight EURUSD made the target just under 1.43 that I gave on Tuesday morning and reversed hard there. A significant inflection point then came an hour ago when EURUSD hit the rising support trendline from the recent low. EURUSD bounced hard there and my suspicion that an ascending triangle might be forming on EURUSD was confirmed. Looking at the chart the next target is triangle resistance at 1.427 – 1.4285, but the important thing to note about these triangles is that they break up 70% of the time. If and when this triangle breaks up that should give equities a decent boost and carry ES up with it to the next resistance level in the mid-1340s. Here's how that looks on the 60min chart and you can read more about ascending triangles at Bulkowski's site here:
ES has respected the established support / resistance levels well. I marked in the current key levels at 1329.5 and 1315.5 a couple of days ago and was happy to see the high at the upper level yesterday and a double test of the lower level overnight. If 1329.5 can be broken today then I'm looking for a move to the next level up at 1343. If support fails at 1315.5, I'd be looking for a retest of support at 1302.25:

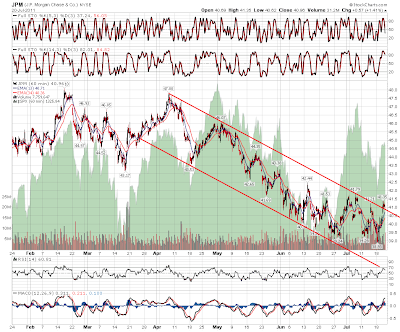
I haven't posted the XLF chart much lately, and that's because apart from a worrying support break and some positive divergence on the daily chart, it isn't really saying much to me. I did post the JPM charts the other day showing the potentially stellar long setup there on a break up from the declining channel on the 60min chart, and yesterday JPM broke up from that channel. I've taken a spec long at 41 and it was trading under that at the close yesterday for anyone thinking of joining me:
That's it for today, apart from adding that I'm doubtful about this current move being the start of a big bull wave up like the one we saw last summer. I think there's a good chance of ES recovering the 1343 area, but after that I'll be watching support trendlines and patterns to signal a reversal which I suspect may not be long in coming. Meanwhile I'm enjoying the bull side here.




