Slope of Hope Blog Posts

Slope initially began as a blog, so this is where most of the website’s content resides. Here we have tens of thousands of posts dating back over a decade. These are listed in reverse chronological order. Click on any category icon below to see posts tagged with that particular subject, or click on a word in the category cloud on the right side of the screen for more specific choices.

Chart on Oil (Mike Paulenoff)

By -

For better or worse, richer or poorer, my big picture pattern work on oil continues to warn me that I should treat the May decline from $87.15 to $64.24 as the first downleg either in a large, incomplete correction, or the first downleg in a bear market for oil.
The only way to invalidate those scenarios will occur on a price climb that hurdles $87.15. Barring upside continuation, the bearish scenarios projects to an optimal target of $63-$58. Whether or not today’s weakness represents the end of the “recovery rally” or just a pause prior to yet another surge towards the May high is too early to tell. However, as of this moment, the nearby oil price action has the potential to put in a significant downside reversal day, which is a strong signal that a near-term trend change has occurred for oil.

T5589VmWJ
Originally published on MPTrader.com.

Chart on Gold (Mike Paulenoff)

By -

Spot gold prices rocketed again in overnight trading, reacting to Bank of Japan's renewed ZIRP as a cue to investors to get out of very low or no rate of return investments into riskier ones! Gold certainly qualifies and also satisfies the desire to protect against an inflationary shock that likely is the light at the far end of the "tunnel," as well as against domestic and global political instability.

My intermediate-term work points to $1350/80 next, which is just 2%-4% above current levels and just might represent a minor target in a price move that appears to be picking up "parabolic" type pattern momentum. At this juncture, only a decline that breaks $1280 will begin to compromise the powerful upside assault of gold prices.

CXhcrtQjF
Originally published on MPTrader.com.

Who Killed the US Dollar? (by Springheel Jack)

By -

It was Ben Bernanke, from a helicopter, with a printing press!

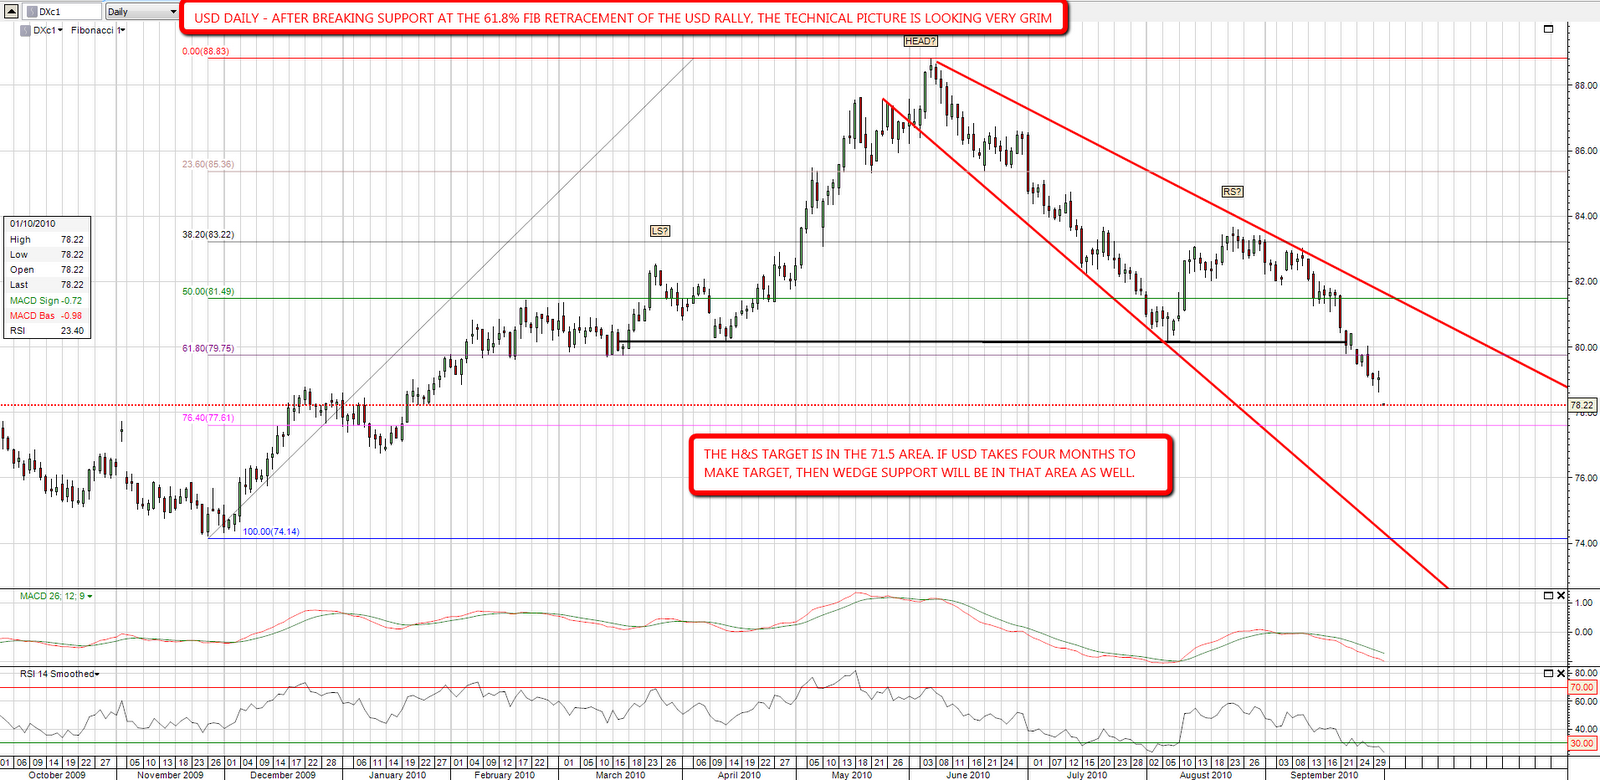
Cluedo jokes aside though. I've been looking at the technical picture on USD and it really is starting to look very grim. The Fed is inflicting damage to USD, and IMO at least to the long term health of the US economy, on a scale that Osama Bin Laden could only dream of managing. Ben Bernanke could well succeed in doing to USD what the PIIGs have failed to do so far to the Euro.

After breaking support at the 61.8% fib retracement of the USD rally, a new low is looking very possible. If we take three or four months to reach it, then the wedge target would be at the same level as the H&S target:

A similarly bleak picture in the inverse can be seen on EURUSD:

The picture looks marginally less optimistic on GBPUSD, where the big rising wedge that is forming looks potentially longer term bearish for cable at least. It is a monster pattern though, and GBPUSD could run up a lot further within it. I would point out though that rising wedges break up 31% of the time and that this rising wedge could also be an IHS with an upsloping neckline:

One thing I've been watching as the markets in the developed world have stalled in the last two weeks is how emerging markets and commodities have continued to run up. I've posted the rising wedges on GYX and EEM in recent days to show the big rising wedges on both. GYX continued up to hit the upper wedge trendline on Friday:

That looked encouraging for the bear side until I looked at the updated EEM chart, where the upper trendline has been hit and then gapped through. That could still be a wedge overthrow but this is not at all encouraging for seeing an interim top in the near future:

One of the few bright spots for bears at the moment has been the lagging financial sector, where XLF has been strongly underperforming SPX. I'm wondering though whether that is going to help the bears during what is beginning to look like a run on USD. That run on USD might help the bears only if the run triggers a general flight from all US denominated assets over the next few months, and it is possible that we are seeing the start of that at the moment:

I was reading earlier this week that on current trends the Fed is likely to overtake both Japan and China within two months to become the largest holder of US treasuries in the world. Every dollar of that holding has been purchased with a freshly printed dollar, so in effect the US has just been printing money to finance the ever increasing fiscal deficits. That is a policy that, when sustained, has only ever ended one way historically. Ben Bernanke is determined to avoid deflation, and he has the tools to avoid it for certain. You should always be careful what you wish for however, you might just get it. 🙂

Anyway, just some weekend thoughts. It's my birthday today and I'll be going to a wonderful restaurant / pub with the family for a great lazy afternoon. This being the UK, the weather stinks of course, but we'll be staying inside. Everyone have a great rest of the weekend. (Note from Tim: Happy Birthday, SHJ! We love ya!)


Just a Little Further I Think (by Springheel Jack)

By -

I've been trying to keep these posts down to five charts per day as I'm cutting back on the time I spend preparing them, and also because Tim was muttering the other day about header posts that could be seen from space after I did a morning post with seven charts.

Some days that requires some hard choices and this is one of those days, as the market action over the last day has been very interesting on a number of fronts. One of the charts that hasn't made the cut today was the oil chart, which made my target 1.60 rise yesterday, and has run up a further 1.25 to 80.85 at the time of writing. I'm seeing a possible broadening ascending wedge on that and if so I'm expecting to see resistance in the 81.5 area. You can easily see what I'm seeing by looking at yesterday's oil chart and taking the upper trendline from the last two highs.

I've not had much to work with on ES and SPX lately in terms of channels or patterns so I was delighted to see that the low yesterday gave me a gently rising channel. The next upside target on ES is in the 1158 if reached today. I'm regarding this as a topping pattern as I think we're close to a significant interim top, but for a number of reasons I don't think we've seen the top yet, so I think there is a good chance that we will see that upper trendline hit in the next couple of days:

101001_ES_60min_Rising_Channel

On EEM we almost saw a hit of the top trendline of the rising wedge that I posted yesterday, but not quite, and that sums up where I think we are at the moment. We've almost seen a rise high enough to hit the next significant interim top, but not quite. I have an almost identical rising wedge on GYX, the industrial metals index, and on the daily chart we have seen a rise to almost the top of the wedge but again, we're not quite there yet:

101001 GYX Daily Rising Wedge

I was very pleased with my little rising channel on the Vix 30min chart yesterday, and we saw a perfect touch and reversal off the upper channel trendline at the SPX low yesterday. This should be a very useful channel for calling SPX short term highs and lows over the next couple of days:

101001 Vix 30min Rising Channel

One thing that's been troubling me about seeing an interim top here has been the copper chart where we have a very nicely formed rising wedge that has now very clearly broken up beyond the stage where the break could be a wedge overthrow. The rising wedge target is 398, and I have a strong rising resistance trendline slightly above there in the 405 – 410 area. I think that the wedge target looks likely to be made, and once we get that far, we may well make the target above, which is the key upside target for copper in my view:

101001_Copper_60min_Rising_Wedge_and_Resistance

EURUSD pulled back slightly yesterday but has since made another high, and my next wedge trendline target is in the 1.39 to 1.395 area:

101001_EURUSD_60min_BA_Wedge

It might be that we'll drop from here without further highs, but I'm not seeing that at the moment. There are some more upside targets that should be hit before we make the next significant interim top and I think we may well hit those in the next two or three days. I'm thinking in terms of seeing that on SPX in the 1165 – 1170 area.

I noticed some of the Gann guys were talking about October 4th/5th as a possible significant reversal area and that could well be right.

Chart on GLD (Mike Paulenoff)

By -

So far today, the weakness in the SPDR Gold Shares (NYSE: GLD) has not inflicted significant technical damage to the Aug-Sept uptrend. To do that, the GLD must break back beneath today's low at 126.61– and follow through to violate the prior significant pivot low at 125.58.

A breach of 125.58 will inflict meaningful damage to the dominant uptrend, which should trigger additional selling pressure that drives the GLD to test and likely break its Aug-Sept up trendline, now at 124.80 within a developing correction of the the two month, 12% advance. Barring a break of today's initial low intraday low at 126.61, however, the bulls will remain in directional control.

XdSVsBFcP
Originally published on MPTrader.com.