Slope of Hope Blog Posts

Slope initially began as a blog, so this is where most of the website’s content resides. Here we have tens of thousands of posts dating back over a decade. These are listed in reverse chronological order. Click on any category icon below to see posts tagged with that particular subject, or click on a word in the category cloud on the right side of the screen for more specific choices.

European Money Supply and Private Loans Dip

By -

Another time-out from my mini-holiday to slip this in:

Data released pre-market today showed a drop in European Money Supply, as shown on the graph below (courtesy of www.forexfactory.com). As can be seen, the total quantity of domestic currency in circulation and deposited in banks is still well below the levels seen from 2000 to 2009…not a healthy sign that would point to additional spending and investment in Europe.

Additionally, data released pre-market today showed a drop in Private Loans to consumers and businesses, as shown on the graph below. As well, the level of loans taken out are well below the levels seen from 2003 to 2009…which indicates that consumers and businesses are not confident in their future financial position, nor do they feel comfortable spending money.

Below is a Monthly chart of EUR/USD. At the moment, price has dipped below the 1.30 level and is hovering below trendline support. It has had difficulty moving above the 1.50 level since 2009 and has been, basically, range-bound from around 1.90/20 to 1.50. There is confluence support around 1.24…a break of that level could send price down to 1.20…a break of that level with confidence could see price drop to a confluence support level around 1.09/10.

This big picture view of the Euro tells me that it is weak and has not been able to sustain its rallies above 1.20 since October 2008. I wouldn't be surprised to see it retest that level sometime in the new year, with a possible dip, or significant drop, below. Also, the economic releases out of Europe lately (which I've posted) all point to a shrinking economy…there's no reason the currency shouldn't also follow suit.

Back to my holiday…


http://strawberryblondesmarketsummary.blogspot.com/

European Economic Weakness

By -

A quick time-out from my mini-holiday to report this…

Data released today showed a further drop in the Swiss economy, as shown on the graph below (courtesy of www.forexfactory.com). It's a combined reading of 12 economic indicators related to banking confidence, production, new orders, consumer confidence, and housing. It's designed to predict the direction of the economy over the following 6 months. The impact tends to be significant, but varies from month to month. It's just another set of data that's been released lately which confirms weakening in the European economy.

(more…)

Three Dows…DBC vs AUD/USD…DBA vs POT vs SPX

By -

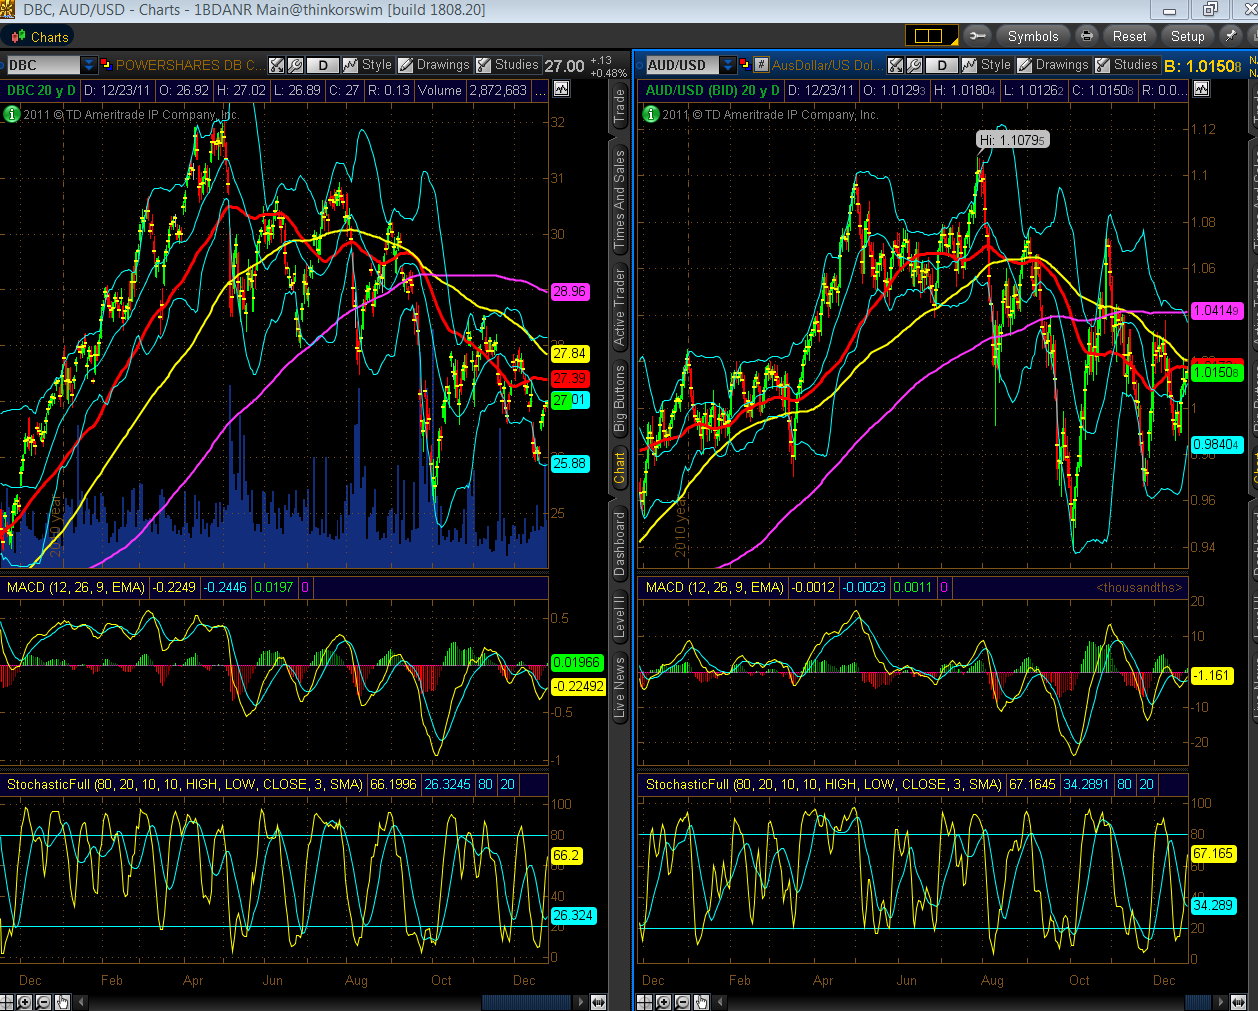
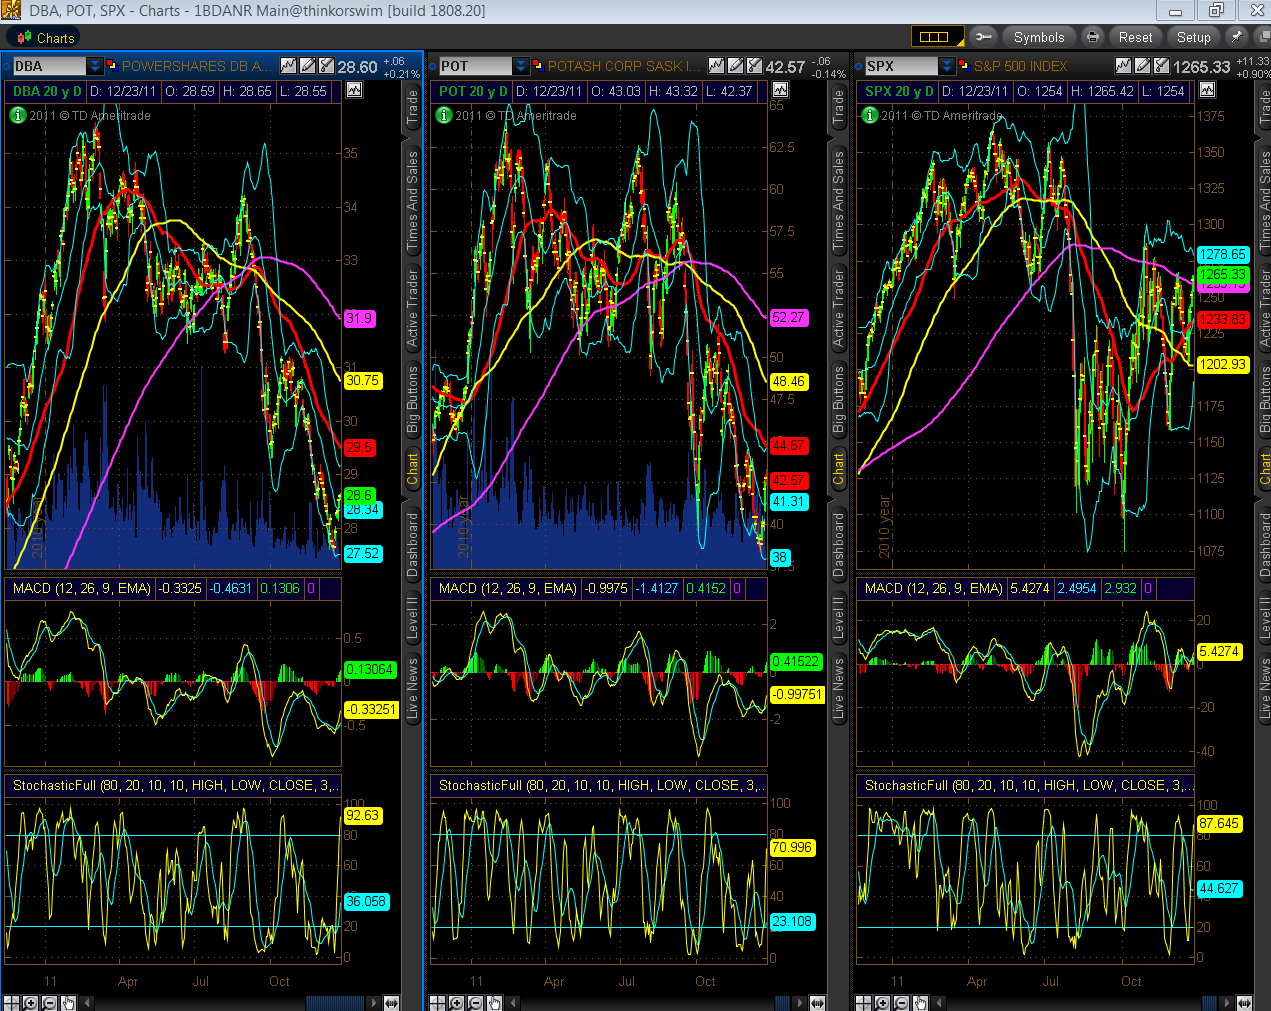
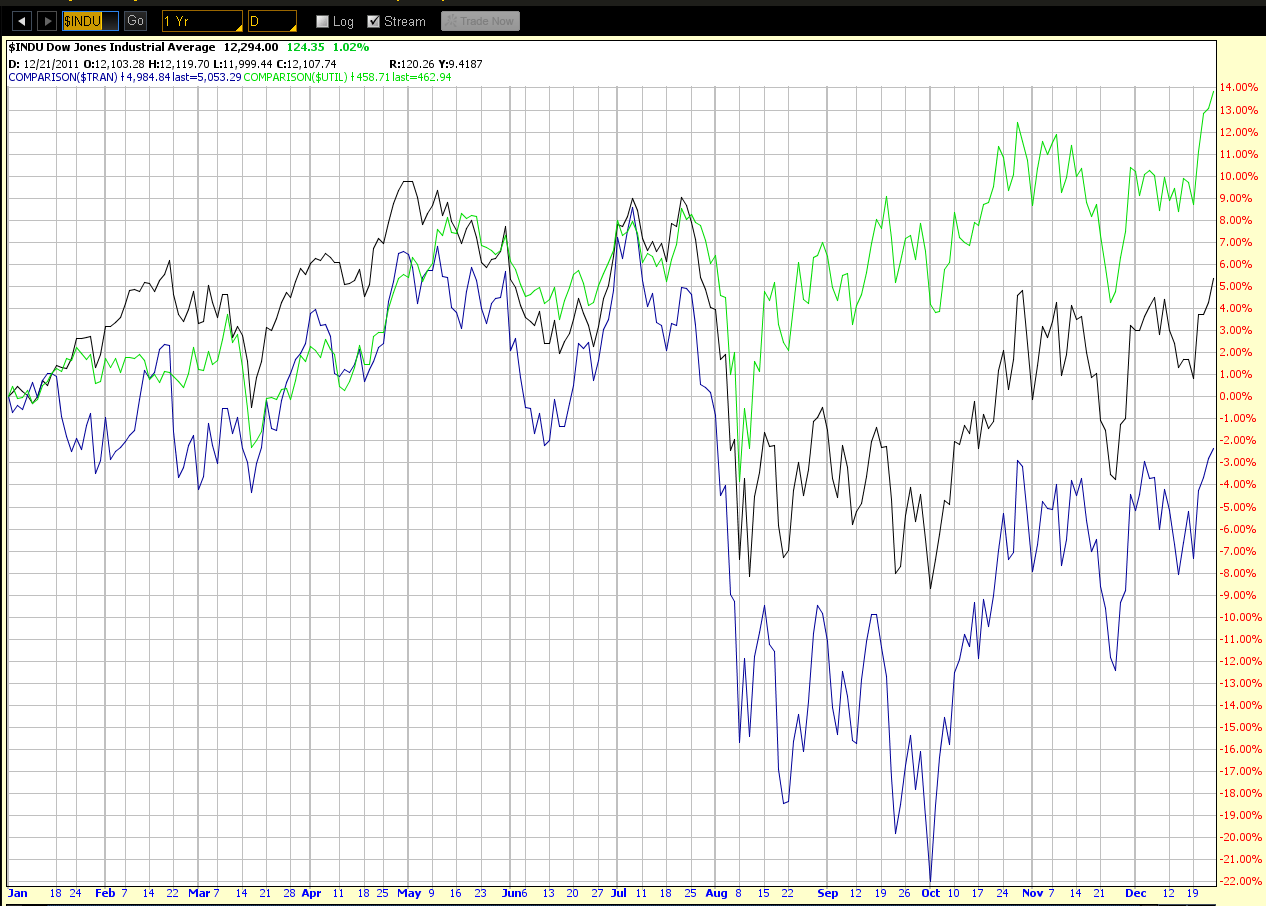
Below are 3 Daily chartgrids of the following (first I'll show a series of charts, then provide some general comments and a summation at the end of this post):

  1. 3 Dows
  2. DBC (Commodities ETF) and AUD/USD
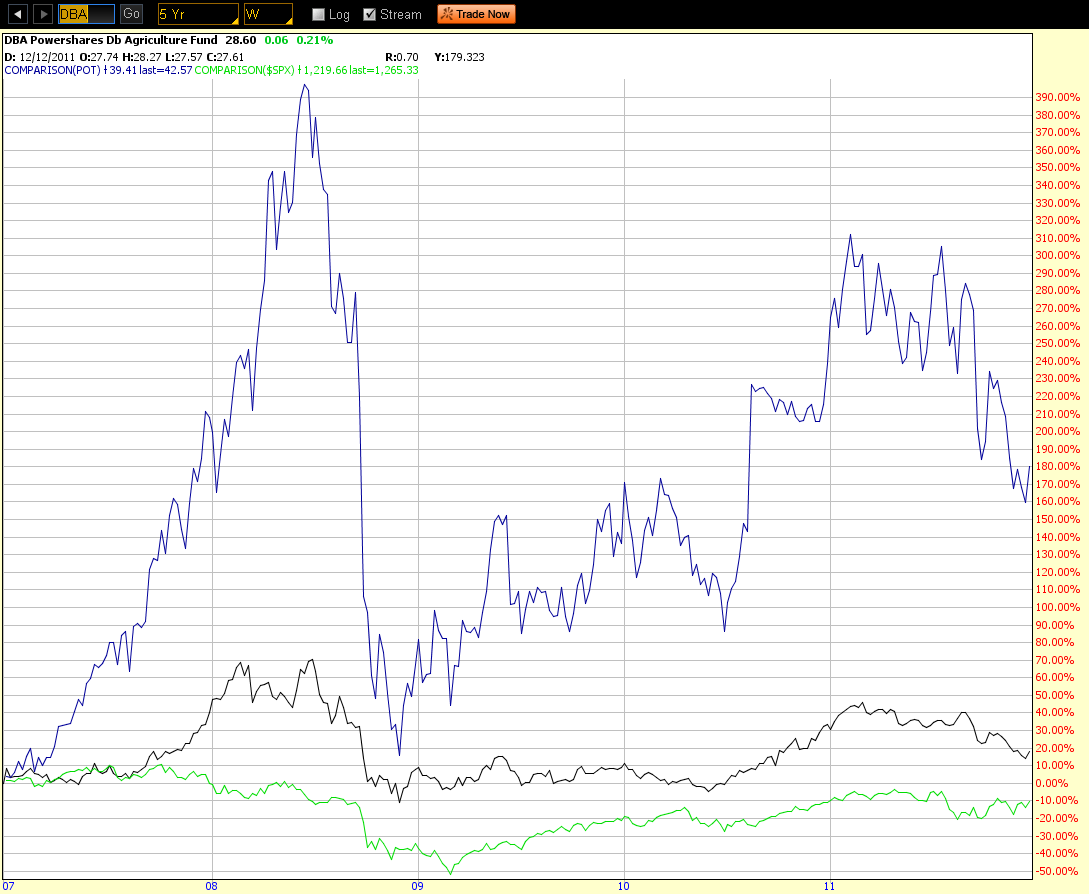
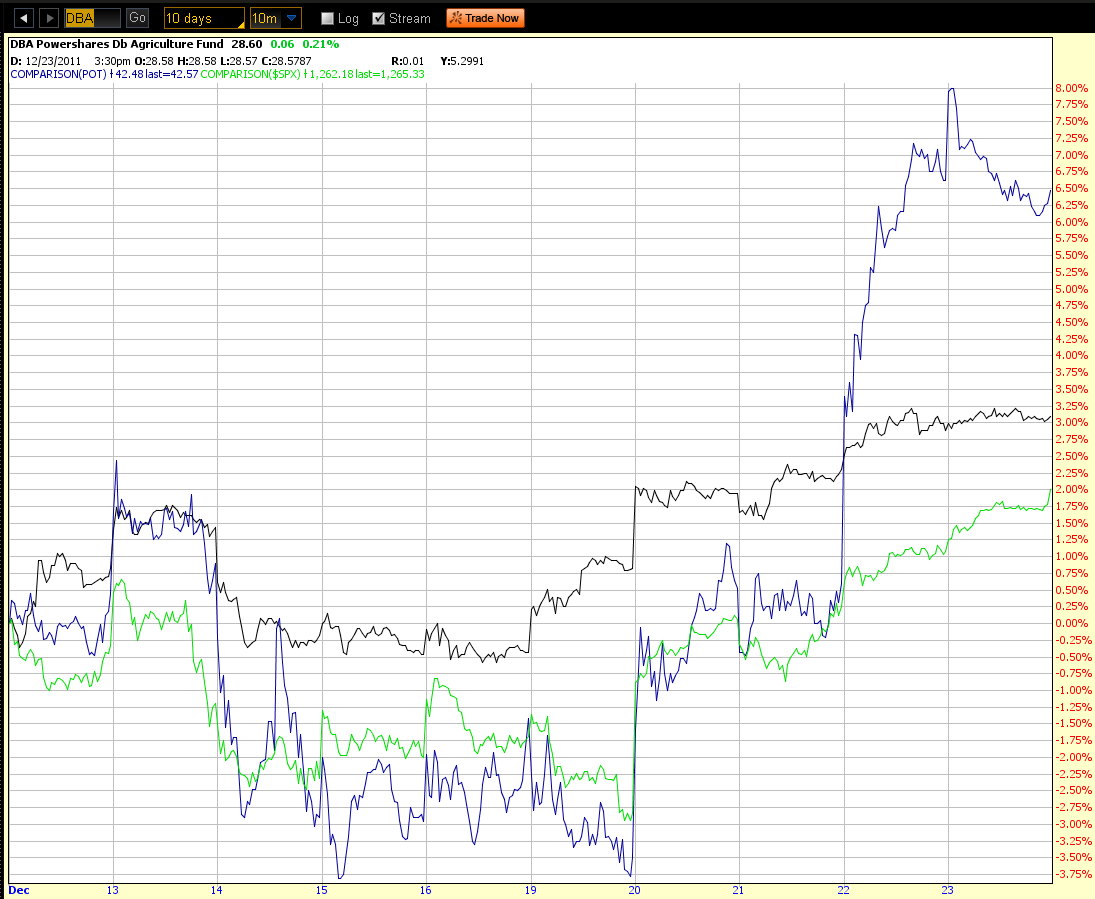
  3. DBA (Agricultural Commodities ETF), POT and SPX 


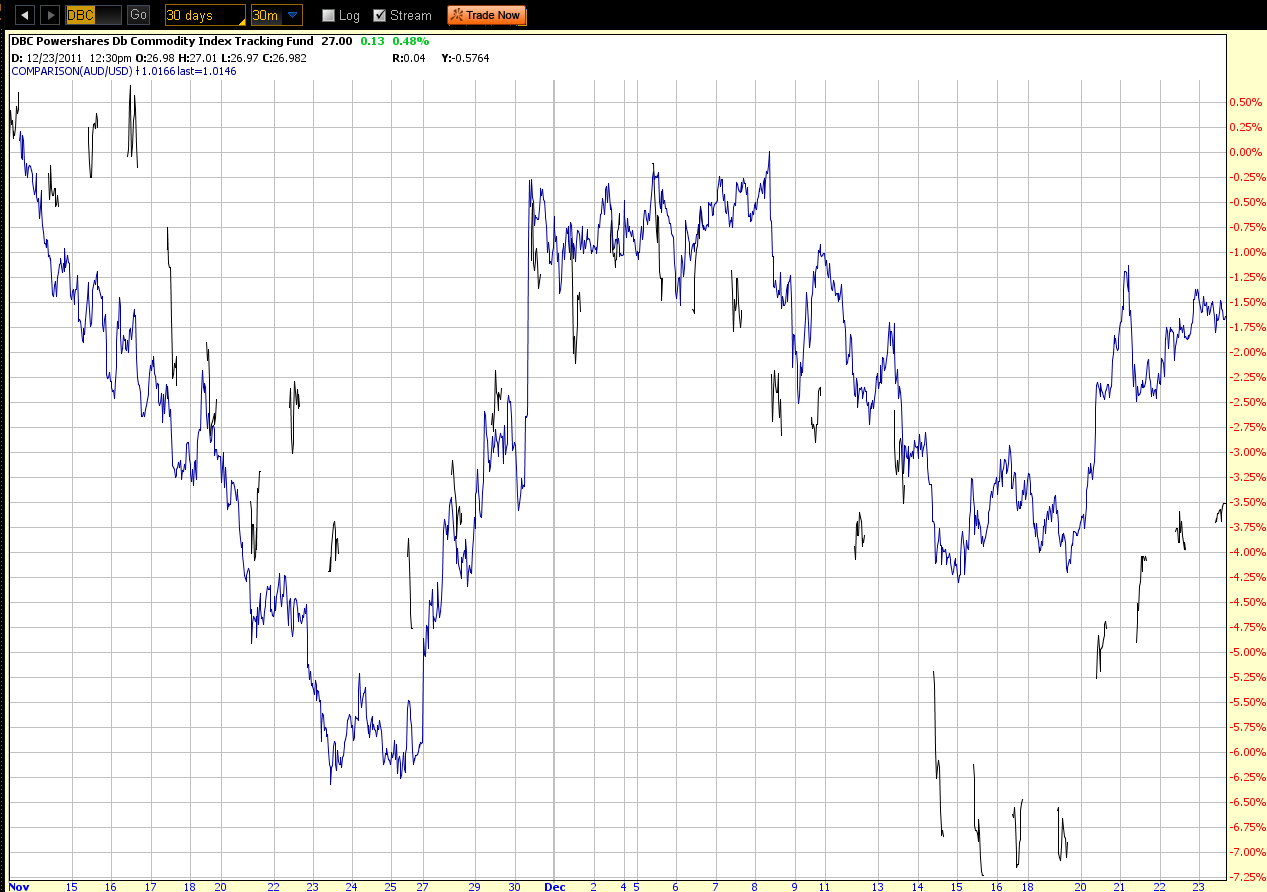
Below are a series of percentage comparison charts of these instruments on varying timeframes:


General Observations:

  • All instruments are at or near their overbought level on the Stochastics indicator
  • Momentum is in positive territory above Zero on all instruments
  • The only one to have made a new high since August this year is the Dow Utilities, and it is in a definite uptrend on the Daily timeframe
  • Of the 3 Dows, Utilities has been leading in strength this year, followed by the Dow 30, then Transports
  • They have all rallied this past week
  • The Dow 30, Dow Transports, and SPX are attempting to re-form an uptrend on the Daily timeframe
  • DBC, AUD/USD, DBA, and POT are all still in definite downtrend
  • During the past 30 days, DBC fell below the AUD/USD, but regained in terms of strength the past 4 days
  • During the past 5 Years, POT has shown relative strength as compared to DBA and SPX…SPX began to diverge and fall in 2008, while POT shot up to new highs…POT was the first to show signs of recovery before SPX near the end of 2008…during the Year-to-date, we're seeing a divergence this past quarter with SPX advancing while POT and DBA continue to drop, apart from an upswing this past week
  • Over the past 10 Days, POT and DBA stabilized…DBA moved above SPX…and POT jumped ahead of both DBA and SPX during the past 2 days 


Summary:

Generally, these markets are beginning to look a bit overbought. However, with momentum in positive territory, they may only pull back sufficiently to relieve this situation in the short term…a "tell" as to whether they may then continue to rally would be to see if momentum stays above zero. I'd look for continued strength in DBC and AUD/USD…any developing weakness of significance could have an negative effect on the equity markets. I'd also look for continued strength in DBA and POT…a drastic drop in POT could, ultimately, have a major impact on the equity markets.


http://strawberryblondesmarketsummary.blogspot.com/


Gappy Christmas!

By -

Below are a series of chartgrids of the YM, ES, NQ & TF. I'll provide a bit of commentary on each.

Year-to-date Weekly charts:

  • Each e-mini futures index is either at or near a resistance confluence of price plus indicator
  • YM is at Volume Profile POC, but trading above its mid-Bollinger Band and 50 sma (red)
  • ES is at its 50 sma, above its mid-Bollinger Band, and below its POC
  • NQ is at just below its POC and 50 sma, and above its mid-Bollinger Band
  • TF is below its 50 sma, well below its POC, and above its mid-Bollinger Band  

(more…)

Diverging Data (by Strawberry Blonde)

By -

A variety of data released today, shows a divergence between a decline in personal spending and income versus an increase in new home sales (although sales remain depressed at the lows of their 2008/09/10 levels), as shown on the three graphs below (courtesy of www.forexfactory.com).

It appears that more household debt is being accumulated than can be effectively managed.

(more…)