Slope of Hope Blog Posts

Slope initially began as a blog, so this is where most of the website’s content resides. Here we have tens of thousands of posts dating back over a decade. These are listed in reverse chronological order. Click on any category icon below to see posts tagged with that particular subject, or click on a word in the category cloud on the right side of the screen for more specific choices.

The AAPL of Nasdaq’s Eye

By -

AAPL is one of a very few Nasdaq stocks in the green, so far, today. At the moment, it's trading at the +2 deviation of an uptrending regression channel following a large volume spike on yesterday's price action, as shown on the Daily chart below. As it approaches the 500 level, the indicators are pointing to an overbought situation…price may ultimately revert to the channel "mean."

This may be what the NQ is waiting for before it pulls back by any significant amount, as I discussed in my February 9th post.

Watching Japan’s Nikkei Futures Index

By -

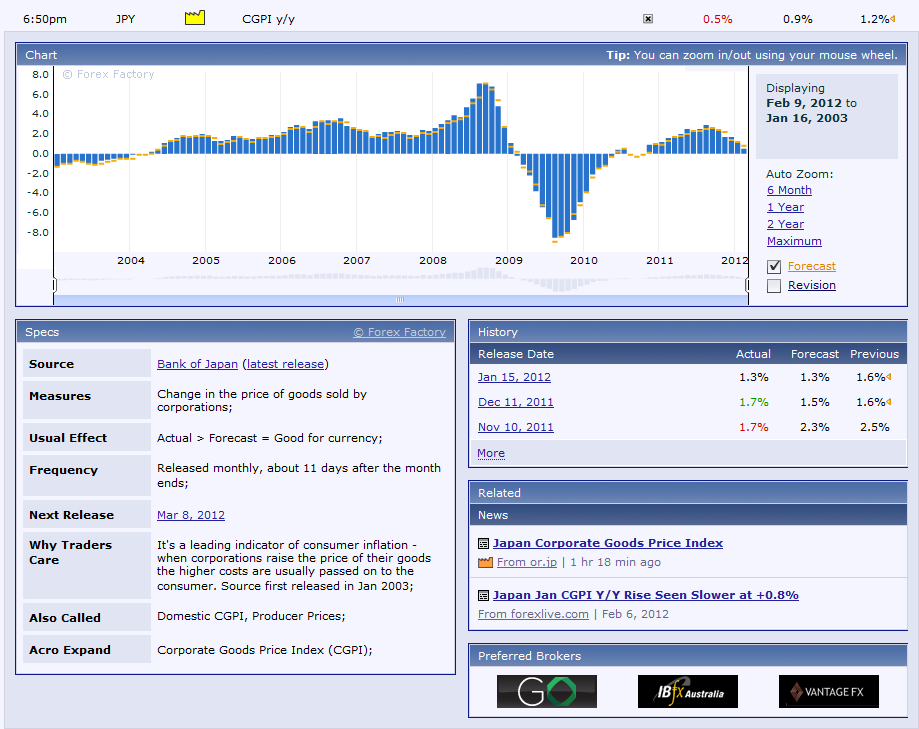
Data released tonight showed another monthly decline in CGPI y/y (change in the price of goods sold by corporations) in Japan. This level is approaching zero and is in danger of falling into negative territory, as it did in 2009.

Since it's a leading indicator of consumer inflation, this suggests that Japan's inflation is teetering on deflation…one to watch for future month's releases.
The Daily chart below of Japan's Nikkei e-mini futures index, NKD, shows that price has pushed above a major downtrend line from the July 2007 high (broken green) and has stalled today at the declining 200 sma (broken pink). Price is sitting just below 9100 (red), which represents price resistance, through which it declined on August 8th, 2011, the Monday after Standard and Poor's downgrade of the U.S. credit rating.

It will be interesting to see if near-term support holds at 8910ish or if near-term resistance holds at 9100…a solid break and hold below/above these levels on sustained volumes should set up the next move for this index.


http://www.strawberryblondesmarketsummary.com/

Imminent Tech and Dow Transports Rollover?

By -

Below is a Daily chart of NQ. Overlayed are a number of lines, particularly a "pink diamond" formation that occurred during the first one-third of 2011, Fibonacci fanlines, several trendlines, and price levels.

Eventually the diamond broke to the downside and dropped to almost an identical level in height to that of the diamond (broken pink lines), nearly touched the 127.2% Fibonacci fanline (yellow), and pierced an extension of one of the diamond trendlines.

Price is approaching a similar measured move which, if it reaches it, would take it to 2616.50, where it would first be met by the 78.6% Fibonacci fanline (broken purple), and then up several points to 2620.25 which is the same height as that of the diamond. Should price pull back from that level, near-term support is back down at the top of the diamond at 2403. 50% of that move would take it down to 2500ish.

(more…)