Slope of Hope Blog Posts

Slope initially began as a blog, so this is where most of the website’s content resides. Here we have tens of thousands of posts dating back over a decade. These are listed in reverse chronological order. Click on any category icon below to see posts tagged with that particular subject, or click on a word in the category cloud on the right side of the screen for more specific choices.

Follow-Through Needed

By -

Further to my posts of July 16th and July 17th, here's how the current 3 days/candle closed today on the Major Indices.

On the 4 equity indices, we need to see further strength enter on the Nasdaq 100 and the Russell 2000 in order to support any further rally on the Dow 30 and S&P 500.

On the 3 Dow indices, we need to see further strength enter on the Dow Transports in order to support any further rally on the Dow 30 and Dow Utilities.

Unless we see further upside continuation on all Major Indices, we'll likely see an ultimate failure of the recent upward sloping channel which begins at the June lows, with a potential move lower than those lows, as these markets are looking tired, laboured, and choppy.

(more…)

Market Action During Bernanke

By -

I have a couple of remarks to make about the morning's action, so far, during Mr. Bernanke's testimony before the Senate Banking Committee.

Further to my post of July 16th, a near-term support level of 483.00 has been re-tested and is holding, so far, on the Utilities Index, as shown on the 15 min chart below…one level that I'm watching relative to weakness/strength on the other Major Indices. Near-term resistance of 485.60-486.00 lies overhead and would need to be overcome in order to push the other markets higher.

The low and high of the recent small "diamond" pattern on the SPX:VIX ratio pair have been re-tested this morning as shown on the 60 min chart below…price now sits at the next resistance level of 83.93…the next hurdle for the SPX to overcome if it is to resume a rally.


Price Action on the Major Indices

By -

Each candle represents 3 days on all of the charts below of the Major Indices…the current candle will close tomorrow.

You can see they're in a tight upward trending channel (which is intact for the moment), with price action swirling around the 50 sma (red) since mid-May. Resistance remains overhead from April/May. The exception to this is the Utilities Index, which is well above its 50 sma, with near-term resistance from mid-June…and one to watch for evidence of any damaging weakness entering that may spill over into the other Major Indices…otherwise, I'd expect this channel to hold.

Who Will Foot the World’s Bill?

By -

All the talk this year of “QE and monetary stimulus” and yet no action from any of the three major world economies makes me think that each one is waiting for the other to reach into their pocket first and fund what would likely fuel a temporary rally in world markets.

The questions are:

  • + Is it warranted?
  • + Can they afford it in the long run?
  • + What purpose would this serve in the long run?
  • + Who is willing to pick up the tab?
  • + How much would they provide?
  • + For how long would they keep the purse open?
  • + Who has the most to gain from such action?
  • + Who cannot afford to sit back and wait?

(more…)

Money Flow for July Week Two

By -

Further to my last weekly market update, here is my commentary on the long, medium, and short-term trend/risk appetite of the 4 Major Indices and 9 Major Sectors relative to their Monthly, Weekly, and Daily charts, respectively. Please refer to that post for an explanation of how my “BULLISH/BEARISH” and “RISK ON/RISK OFF” labels are derived.

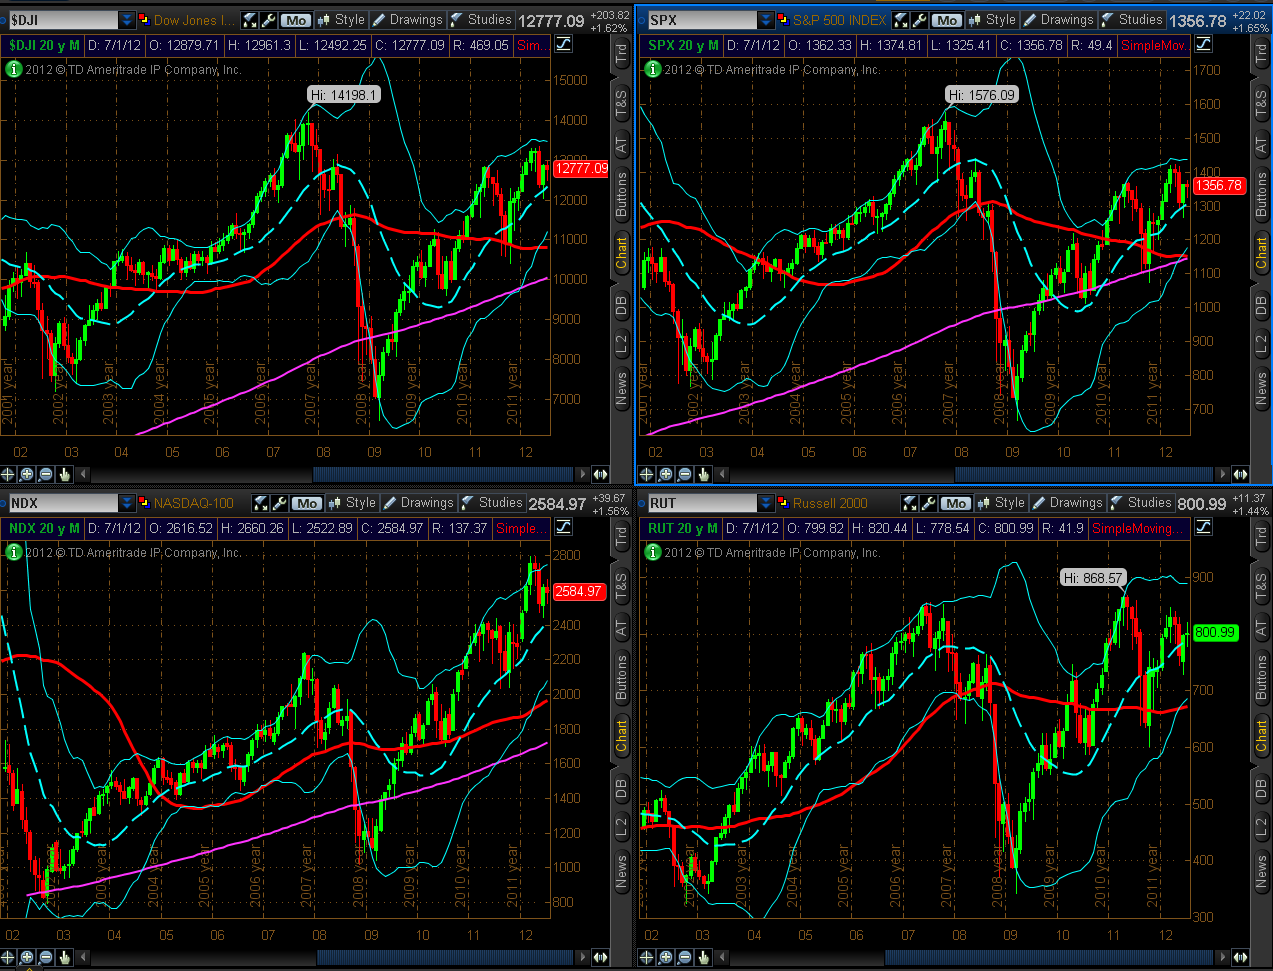
Chartgrid #1 depicts a Monthly timeframe of the 4 Major Indices (Dow 30, S&P 500, Nasdaq 100, and Russell 2000)…my comments refer to the current month’s (July’s) candle.

  • “BULLISH” so far this month for all 4 Indices.
  • “RISK OFF” so far this month on the Dow, S&P, and Nasdaq. “RISK ON” on the Russell. Still room for these indices to rally to their upper Bollinger Band if they stay above the “MEAN.”
  • Long term, the Russell is lagging in strength and is the one to watch, as a drop below its “MEAN” could send it down to the lower Bollinger Band and pull the others down with it. The S&P is in imminent danger of a bearish moving average “Death Cross” formation occurring on this timeframe…one to watch for market reaction. High-wave spinning top candles depict market indecision on this timeframe.

(more…)